
Abstract
The recent discovery by the LHAASO collaboration of a variable ultrahigh-energy (UHE; Eγ ≥ 100 TeV) γ-ray source associated with the microquasar Cygnus X-3, with a spectrum extending to several PeV, provides compelling evidence for a hadronic super-PeVatron operating within the binary system. Inside the binary, the accelerated protons lose only a small fraction of their energy; upon escaping into the interstellar medium, they propagate diffusively to form a vast γ-ray “halo” structure extended to hundreds of parsecs. We argue that this halo has already been detected and corresponds to the Cygnus Bubble, an extended UHE γ-ray source reported by the LHAASO collaboration—which possesses an angular extension of ≈6° and an energy spectrum reaching 1 PeV. While the Cygnus Bubble is generally attributed to the star-forming region Cygnus X (specifically the Cygnus OB2 association at 1.4 kpc), we demonstrate that an association with Cygnus X-3 is physically more natural at energies above 400 TeV. This is supported by the cosmic-ray radial distribution, derived from the γ-ray and gas distributions, which points to continuous injection from a point-like source. The energetic requirements of the central accelerator are reasonably affordable and feasible. This reassignment identifies the Cygnus Bubble as a member of the recently discovered population of microquasar UHE γ-ray halos.
Original content from this work may be used under the terms of the Creative Commons Attribution 4.0 licence. Any further distribution of this work must maintain attribution to the author(s) and the title of the work, journal citation and DOI.
1. Introduction
Recent detections of dozens of ultrahigh-energy (UHE) γ-ray sources (Z. Cao et al. 2024) have revealed a growing population of Galactic PeVatrons—cosmic accelerators capable of boosting particles to PeV energies. Most of these sources are spatially extended γ-ray structures associated with pulsar wind nebulae (PWNe), molecular clouds in the proximity of middle-aged supernova remnants (SNRs), and bubbles surrounding microquasars, hereafter referred to as “microquasar halos” (μQSHs). Generally, the γ-ray emission does not spatially coincide with the particle accelerator itself; rather, the γ-ray morphology reflects the complex interplay between the spatial distribution of relativistic particles and the ambient target medium. Consequently, identifying the specific acceleration sites remains challenging and requires deep phenomenological and theoretical studies based on comprehensive multiwavelength analysis.
In μQSHs, relativistic particles may originate within the compact binary system, at the parsec-scale termination of the outflow (jets or winds), or both. For most sources, current observations cannot distinguish between these sites. Cygnus X-3, however, stands out as a unique case; the reported UHE γ-ray variability (The LHAASO Collaboration et al. 2025), specifically its modulation at the 4.8 hr orbital period, indicates that acceleration and emission occur within a compact region, likely associated with a (sub)relativistic wind or jet inside the binary. The production of UHE γ-rays extended beyond 1 PeV inside the binary system points to the presence of a hadronic super-PeVatron, precluding any “leptonic” contribution; because of severe synchrotron and inverse Compton losses, even at the maximum possible theoretical acceleration rate, electrons cannot reach PeV energies (The LHAASO Collaboration et al. 2025). Notably, a hadronic PeVatron localized within the binary system does not preclude the further acceleration of PeV particles in a large-scale “jet-termination” scenario.
Within the binary environment, the accelerated protons lose only a small fraction of their energy and escape into the surrounding medium without significant deformation of their initial (acceleration) spectrum. Upon entering the interstellar medium (ISM), these particles propagate diffusively, interacting with the ambient gas to form a vast γ-ray “halo” extending over hundreds of parsecs. The detectability of such a structure depends primarily on the medium’s diffusion coefficient and the target gas density. Generally, in the vicinity of the source, the cosmic-ray (CR) diffusion coefficient must be substantially smaller than the “standard” Galactic value to prevent the rapid runaway of protons and maintain an adequate surface brightness distribution. Such an enhancement of diffusive confinement is physically expected in the surroundings of powerful cosmic-ray accelerators (M. A. Malkov et al. 2013; M. D’Angelo et al. 2016; L. Nava et al. 2016, 2019; B. Schroer et al. 2022). Finally, the detection of these extended features requires instruments highly sensitive to low-surface-brightness emission; in this regard, the LHAASO KM2A detector has uniquely demonstrated its potential to reveal diffuse UHE γ-ray sources throughout the Galactic plane.
Notably, it is likely that a halo around Cygnus X-3 has already been detected. Indeed, the Cygnus Bubble, reported by the LHAASO collaboration as an extended UHE γ-ray source with an angular radius of ≈6 ° toward the Cygnus region (LHAASO Collaboration 2024), matches this description. This statement, at first glance, may seem paradoxical as it opposes the widely accepted view that the Cygnus Bubble is associated with the Cygnus X star-forming region, specifically the Cygnus OB2 association at d1 = 1.4 kpc (F. Aharonian et al. 2019; S. Menchiari et al. 2024; L. Härer et al. 2025). One might argue that assuming the larger distance of Cygnus X-3 (d2 ≈ 9.7 kpc) increases the required γ-ray luminosity by  , or roughly 1.5 orders of magnitude.
However, this does not present a fundamental problem. Depending on the radial dependence of the product of the CR and gas densities, a distant source can be energetically competitive. The observed γ-ray flux, Fγ, resulting from the interaction of CRs with the ambient gas, is proportional to

Assuming power-law spatial distributions for the CR and gas densities,  and
and  , and noting that for a fixed angular size ϑ, the linear size of the source scales as R = ϑd, the flux scales as7

Equation (1) assumes that the volume filled by CRs extends at least to the radius R. This imposes a lower limit on the propagation speed—and correspondingly on the diffusion coefficient—to ensure that particles could reach the physical distance R = ϑd within the operational lifetime of the accelerator.
Crucially, for a fixed accelerator power LCR in a similar gas environment, the γ-ray flux does not follow the standard 1/d2 dilution if the cosmic-ray distribution is maintained by continuous injection. From an observational perspective, given that a fixed angular size implies consistent instrumental performance, the association of the Cygnus Bubble with the distant Cygnus X-3 is physically consistent with the available LHAASO data (The LHAASO Collaboration et al. 2025). Below, we explore this possibility through rigorous calculations that strictly treat particle transport. Specifically, we model the diffusion of particles after their escape from the binary system into the ISM, utilizing a realistic gas distribution surrounding Cygnus X-3 on scales up to 1 kpc. This analysis accounts for the nonisotropic nature of the environment, considering propagation both along the Galactic disk and perpendicular to the Galactic plane.
The Letter is organized as follows: in Section 2, we describe the analytical and numerical methods used to calculate the CR distributions, the resulting γ-ray spectra, and the surface brightness profiles, based on the relevant assumptions regarding the gas distributions. In Section 3, we present the results for various injection parameters and discuss their physical implications. Finally, we summarize our findings, discuss the results, and provide concluding remarks in Section 4.
2. The Model
After being accelerated, particles (for simplicity, we consider only protons) escape the source and propagate diffusively through the surrounding ISM. Assuming spherical symmetry, with the accelerator located at the center and a homogeneous environment, the transport equation (F. A. Aharonian & A. M. Atoyan 1996; V. Bosch-Ramon et al. 2005) for CRs is

where N(E, r, t) is the differential number density of relativistic particles, D(E) is the spatial diffusion coefficient, b(E) = − dE/dt is the energy-loss rate, and Q(E, r, t) is the source function.
The dominant energy-loss process for CR protons is the inelastic collisions with ambient gas. The corresponding cooling time in a pure hydrogen medium is tpp = 
 /40 mb)−1 yr, where c is the speed of light, nH is the number density of ambient hydrogen atoms, κ ≃ 0.5 is the inelasticity coefficient, and σinel is the inelastic pp collision cross section.
The cross section σinel is a weak function of energy and, in the relativistic limit, can be presented, using the parameterization of E. Kafexhiu et al. (2014), as  , with x = E/Tth, where Tth ≈ 0.2797 GeV, is the proton’s threshold kinetic energy for pion production.
The spatial diffusion coefficient is parameterized as

where D0 and δ depend on the level and spectrum of magnetic turbulence in the ISM (A. W. Strong et al. 2007). Since the origin of interstellar turbulence is not fully understood, D0 is treated as a free parameter. We consider both Kolmogorov (δ = 1/3) and Iroshnikov–Kraichnan (δ = 1/2) turbulence spectra. We do not take into account here that the diffusion coefficient transitions to scale as E2 when the gyroradii of CRs are larger than the correlation length of interstellar magnetic turbulence (P. Subedi et al. 2017; G. Giacinti et al. 2018; O. Pezzi et al. 2022).
We assume continuous injection starting at t = 0, so that

where δ3(r) is the Dirac delta function and θ(x) is the Heaviside step function. The injection spectrum is taken as

where s is the spectral index, and E0 is the cutoff energy. The total kinetic power injected into CR protons is  ;
;  is the minimum proton energy.
We do not explicitly address the underlying acceleration mechanisms of CRs, but note that super-Eddington accreting X-ray binaries may accelerate protons up to several tens of PeV (e.g., E. Peretti et al. 2025; J. Wang et al. 2025). Throughout this Letter, we fixed the cutoff energy at E0 = 10 PeV.
The solution of Equation (3) for the continuous injection is (S. I. Syrovatskii 1959)
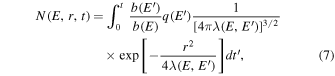
where  is defined through

and

For ultrarelativistic protons, because of the weak energy dependence of σinel, we have ![${E}^{{\prime} }=E\exp [(t-{t}^{{\prime} })/{t}_{{\rm{pp}}}]$](https://content.cld.iop.org/journals/2041-8205/1006/2/L31/revision1/apjlae878eieqn11.gif) , thus (F. A. Aharonian & A. M. Atoyan 1996)
, thus (F. A. Aharonian & A. M. Atoyan 1996)

In the limit t ≪ tpp, Equation (7) is reduced to

Here,  is the complementary error function and
  is the diffusion radius.
2.1. Applying to Cygnus X-3
Due to the large distance of Cygnus X-3 and the strong Galactic extinction along its line of sight, a detailed, high-resolution study of the local ISM surrounding the source is currently lacking. To establish a baseline for the γ-ray production calculations, we first assume a spatially uniform ambient hydrogen density, nH, and then proceed to a more realistic treatment that accounts for the Galactic disk’s global vertical structure.
Following empirical models of the atomic hydrogen (H i) distribution, we adopt a stratified density profile that accounts for the increase of the gas scale height with Galactocentric radius in the outer Galaxy (P. M. W. Kalberla & L. Dedes 2008; P. M. W. Kalberla & J. Kerp 2009). At the Galactocentric radius of Cygnus X-3 (R ≈ 10 kpc), the weakening of the Galactic gravitational potential leads to a vertically extended gas disk with a characteristic scale height of zc = 300 pc (P. M. W. Kalberla & L. Dedes 2008).
We model this vertical dependence using a simple exponential profile

where n0 is the midplane density and zmid = 0.
This vertically extended gas distribution provides an extended hadronic target for CRs injected by the Cygnus X-3 jets. In this way, the model bridges the lack of local high-resolution ISM data with the well-established large-scale structure of the Milky Way, enabling a more realistic estimate of the diffuse UHE γ-ray luminosity produced via pp interactions in the Cygnus region.
Once the distribution of CRs around the accelerator is obtained, the emissivity per hydrogen atom (in units of photons s−1 sr−1 GeV−1) of γ-rays generated from the inelastic pp collisions is computed as following (E. Kafexhiu et al. 2014)

where dσγ/dEγ(Eγ, E) is the differential production cross section of γ-rays, which is provided by the package aafragpy (S. Koldobskiy et al. 2021). Given that the emissivity and gas distribution are known, the γ-ray intensity is

where the integration is along the line of sight (L.O.S.), whose direction is defined by the angular separation from the accelerator ϑ and the azimuthal angle φ, and εM = 2.0 is the nuclear enhancement factor accounting for the contribution to γ-ray production of nuclei heavier than hydrogen in both CRs and ambient gas (M. Mori 2009; M. Kachelriess et al. 2014). The nuclear enhancement is calculated assuming that the CR and ISM compositions are the same as the local ones. When the gas distribution is homogeneous, the γ-ray intensity is independent of φ. On the other hand, when the gas distribution is nonhomogeneous perpendicular to the Galactic plane, we can define the azimuthally averaged γ-ray intensity as  . The γ-ray flux is

where d is the distance to the accelerator, and R is the dimension of the emission region. We assume that R = 1 kpc, which corresponds to an angular radius of ∼6° for the emission region, given that the distance to Cygnus X-3 is d = 9.67 kpc (M. J. Reid & J. C. A. Miller-Jones 2023).
The CRs near their sources can excavate a cavity with a radius of ∼10–50 pc, resulting in partial evacuation of gas from the cavity (B. Schroer et al. 2022). We demonstrate here that this evacuation effect has no significant impact on our estimates of CR acceleration efficiency in Section 3. The diffusion radius of CRs is  at 1 PeV with D = 3 ×1029 cm2 s1 and tage = 100 kyr (refer to Section 3 on the related discussion of model parameters). For the stationary injection, the CR radial distribution is proportional to 1/r when r ≪ rd according to Equation (11). Assuming a homogeneous gas distribution, the γ-ray emissivity is also proportional to 1/r; then the γ-ray flux originating from within radius r is
  , and thus,
  . Now, taking r1 = 50 pc and r2 = 200 pc, we can see that Fγ( < 50 pc)/Fγ( < 200 pc) = 1/16, which means that the γ-ray flux originating from within 50 pc is much smaller than that from within 200 pc. Taking the evacuation into account, the contribution to γ-ray emission from within 50 pc is much smaller, and the γ-ray flux mainly originates from between 50 pc and rd. As a consequence, our estimates on the efficiency are not affected significantly.
3. Results and Discussions
Before discussing the implications of our results, we briefly discuss the selection of model parameters. First, we assume that the injection spectral index s = 2.0 is fixed, which is consistent with the prediction of diffusive shock acceleration theory in strong shocks (e.g., see M. A. Malkov & L. O. Drury 2001). The strong termination shocks driven by fast outflows (winds and jets), which can reach mildly relativistic velocities, in ultraluminous X-ray sources such as the microquasar Cygnus X-3 (A. Veledina et al. 2024) could accelerate CRs effectively to several tens of PeV (e.g., see E. Peretti et al. 2025; J. Wang et al. 2025), while other underlying acceleration mechanisms can not be excluded. Second, since we do not know exactly how long the injection process sustains, we assume that the elapsed time denoted by tage since the injection starts from t = 0 is a free parameter, and we choose four different values, i.e., tage = 100, 200, 300, and 400 kyr, given that the companion of Cygnus X-3 is a Wolf–Rayet star (M. H. van Kerkwijk et al. 1992, 1996). Then, we leave only the diffusion coefficient normalization D0, the ambient gas density nH (n0) for the homogeneous (nonhomogeneous) gas distribution, and the injection kinetic power  the other three free parameters. The γ-ray flux and intensity are proportional to the product
  , which can be determined by the observed data once we know D0. As a fiducial value, we assume that nH = 1.0 cm−3 (n0 = 1.0 cm−3) for the homogeneous (nonhomogeneous) gas distribution. Once choosing D0 = 3 × 1029 cm2 s−1, we find our model can reasonably explain the observed data for both Iroshnikov–Kraichnan (δ = 1/2) and Kolmogorov (δ = 1/3) turbulence, by tuning
  .
.
The radial profile of γ-ray intensity can give crucial information on the spatial distribution of CRs and their injection history. To obtain this radial flux distribution, we extracted the photon distribution within the 6 ° radius region from Figure 1 of LHAASO Collaboration (2024), which contained a total of 66 photon-like events with energies exceeding 400 TeV, with an estimated CR background of 9.5. Using the energy spectrum from Figure 3 of LHAASO Collaboration (2024), we calculated the integrated energy above 400 TeV within the same 6° radius region. After subtracting the CR background, we converted the photon distribution into a radial flux distribution for energies above 400 TeV.
Meanwhile, we estimated the diffuse γ-ray emission utilizing the proton and helium spectra measured by DAMPE (Q. An et al. 2019; F. Alemanno et al. 2021) and LHAASO (Z. Cao et al. 2025, 2026). For the gas distribution, we employed the HI4PI survey data (HI4PI Collaboration et al. 2016) and the CfA 12CO data (T. M. Dame et al. 1987). The column density of neutral hydrogen was calculated by integrating over the entire velocity range using (T. L. Wilson et al. 2013)

The molecular hydrogen column density was derived by

Here, we adopted a mean CO-to-H2 conversion factor of X = 2.0 × 1020 cm−2 K−1 km s (A. D. Bolatto et al. 2013). The total hydrogen column density is  , and we assumed a helium abundance of NHe = 0.1NH in the ISM. We then used aafragpy (S. Koldobskiy et al. 2021) to calculate the diffuse γ-ray emission expected from the local CR proton and helium spectra.
Figure 1 shows the fits of our model to the flux of γ-rays with energies larger than 400 TeV from the Cygnus Bubble within a radius of 6° as observed by LHAASO (LHAASO Collaboration 2024) and the radial profile of integrated γ-ray intensity above 400 TeV (i.e.,  ) in the left and right panels, respectively, for a homogeneous gas distribution. In the left panel, the blue dashed–dotted–dotted line shows the diffuse Galactic γ-ray flux within a 6 ° radius region around Cygnus X-3, while the black and gray lines show the summation of our model and diffuse γ-ray fluxes for Iroshnikov–Kraichnan and Kolmogorov turbulence, respectively, when tage = 100 (solid lines), 200 (dashed lines), 300 (dotted–dashed lines), and 400 (dotted lines) kyr. Moreover, in the right panel, the corresponding lines show the corresponding radial profiles of integrated γ-ray intensity above 400 TeV. As shown in Figure 1, our model can reasonably explain the observed γ-ray flux and intensity radial profile for energies above 400 TeV. In fact, given the parameters we chose as discussed above, the radial profile of integrated γ-ray intensity can be fitted reasonably without fine-tuning the parameters, once we fit our model to the observed γ-ray flux by tuning
  , whose best-fit values are listed in Table 1. Moreover, we find that the required injection kinetic power
  decreases when tage increases, as expected. However, when tage > 400 kyr, we find
  no longer decreases apparently, when increasing tage further. Due to the interplay of continuous injection into and escaping of CRs from the emission region, their distribution tends to N(E, r, t) = q(E)/[4πrD(E)] when r ≪ rd, which is satisfied as tage is large enough. Given that the kinetic luminosity of Cygnus X-3 is estimated to be Lkin = 5 × 1039erg s−1 (A. Veledina et al. 2024; J. Wang et al. 2025), the required acceleration efficiency (
 ) is 0.7%–1.6% according to Table 1. Even though we adopt a lower gas density, for instance, nH = 0.1 cm−3, the required acceleration efficiency is 7%–16%, thus Cygnus X-3 has enough energy budget for accelerating CRs to about 10 PeV.
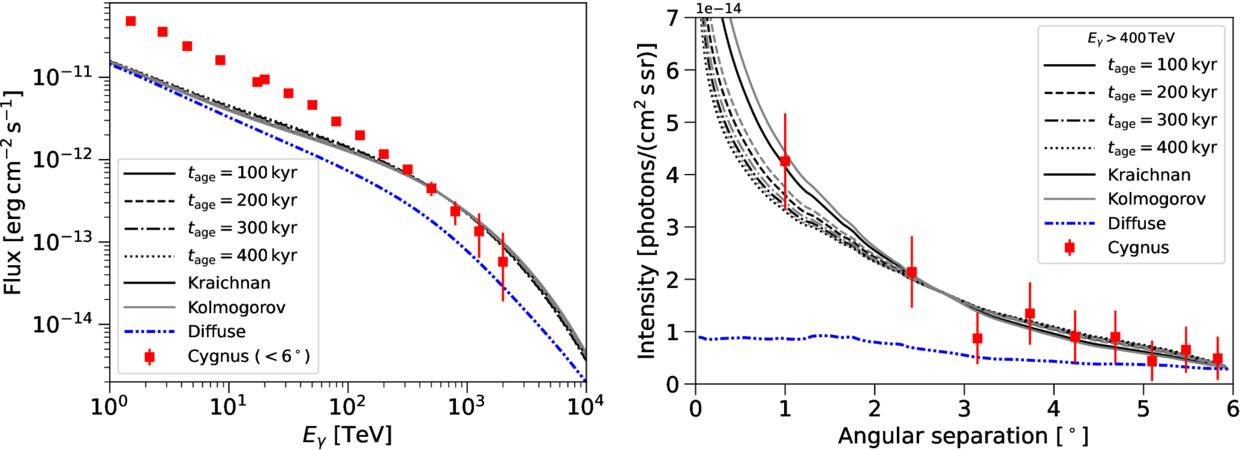
Figure 1. Left panel: the γ-ray flux from within a 6° radius emission region for Iroshnikov–Kraichnan (δ = 1/2; black lines) and Kolmogorov (δ = 1/3; gray lines) turbulence phenomenology, when tage = 100 (solid lines), 200 (dashed lines), 300 (dotdashed lines), and 400 (dotted lines) kyr, which is the elapsed time since the injection starts. The blue dashed–dotted–dotted line shows the diffuse Galactic γ-ray flux, which is produced by the CR “sea” as measured locally on the Earth, while the black and gray lines show the summation of our model and diffuse γ-ray fluxes. The red flux points for a 6° radius bubble are taken from LHAASO Collaboration (2024). The diffusion coefficient normalization D0 = 3 × 1029 cm2 s−1 for both Iroshnikov–Kraichnan and Kolmogorov turbulence, the CR injection spectral index s = 2.0 and its cutoff energy E0 = 10 PeV, the gas distribution is homogeneous and its density nH = 1 cm−3, while the CR injection kinetic powers are given in Table 1. Right panel: the integrated γ-ray intensity above 400 TeV. The line styles and corresponding parameters are the same as the left panel.
Download figure:
Standard image High-resolution imageTable 1. The CR Injection Kinetic Power for a Homogeneous Gas Distribution
| tage |
 [1037 erg s−1] [1037 erg s−1] | |
|---|---|---|
| (kyr) | Kraichnana | Kolmogorova |
| 100 | 8.0 | 7.2 |
| 200 | 5.6 | 4.8 |
| 300 | 4.8 | 4.0 |
| 400 | 4.4 | 3.6 |
Note. aThe CR injection spectrum is an exponentially cutoff power-law function with the spectral index s = 2.0 and the cutoff energy E0 = 10 PeV, while the minimum proton kinetic energy is  . We have assumed that the gas distribution is homogeneous and its density is nH = 1 cm−3. The diffusion coefficient normalization D0 = 3 × 1029 cm2 s−1 for both Iroshnikov–Kraichnan and Kolmogorov turbulence.
Download table as: ASCIITypeset image
As we have discussed at the end of Section 2, the cavity excavated by the CR pressure (B. Schroer et al. 2022) has no significant impact on the γ-ray flux for an emission region with a size of 1000 pc. However, such a low-density cavity embedded in the emission region can leave an imprint on the γ-ray intensity profile. Here, we briefly discuss the aftermath due to the evacuation effect. We assume the cavity has a radius Rcavity = 100 pc, and the evacuated gas accumulates in a thin shell with a thickness ΔR = 5 pc located at the outer surface of the cavity. Therefore, the gas density in the shell is ![${n}_{{\rm{shell}}}={n}_{{\rm{H}}}/[1-{(1-{\rm{\Delta }}R/{R}_{{\rm{cavity}}})}^{3}]=7.0{n}_{{\rm{H}}}$](https://content.cld.iop.org/journals/2041-8205/1006/2/L31/revision1/apjlae878eieqn29.gif) , where nH = 1 cm−3 is the gas density outside of the cavity, which we assume is not affected by the evacuation effect. Figure 2 shows the integrated γ-ray intensity radial profile above 400 TeV taking the evacuation effect into account. All parameters are the same as those discussed in the previous paragraph, except the gas distribution. As shown in Figure 2, there is a characteristic peak around ϑ = 0
, where nH = 1 cm−3 is the gas density outside of the cavity, which we assume is not affected by the evacuation effect. Figure 2 shows the integrated γ-ray intensity radial profile above 400 TeV taking the evacuation effect into account. All parameters are the same as those discussed in the previous paragraph, except the gas distribution. As shown in Figure 2, there is a characteristic peak around ϑ = 0 6 (=Rcavity/d) in the intensity profile, while we verify that the γ-ray flux is almost not affected, at least for energies above 1 TeV for each set of parameters (not shown). However, such a feature can not be resolved by the present LHAASO data, and the future high angular resolution observations may reveal if such a feature exists. Hereafter, we will not consider the evacuation effect.
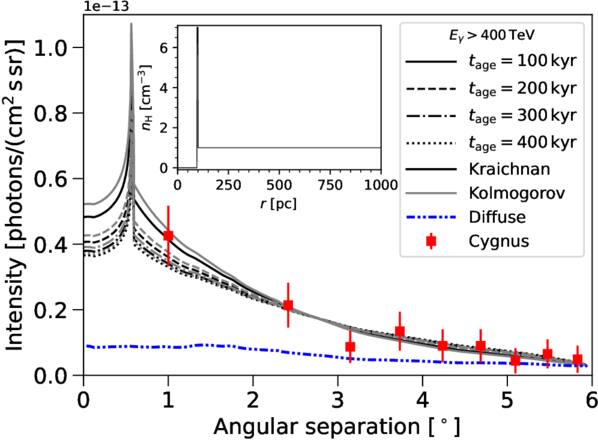
Figure 2. Same as the right panel of Figure 1, but the gas density is given as shown in the inset plot.
Download figure:
Standard image High-resolution imageWhile a homogeneous gas distribution is not realistic and should only be regarded as an average over the emission region, we also consider a more realistic nonhomogeneous gas distribution, which has a finite scale height vertical to the Galactic plane as prescribed by Equation (12). We assume that the midplane gas density n0 = 1.0 cm−3 and the scale height zc = 300 pc. For such a gas distribution, the average gas density within the emission region is about 0.38 cm−3. In Figure 3, the left and right panels show the fits of our model to observed γ-ray flux and intensity radial profile, respectively, while the best-fit values of  are listed in Table 2, assuming D0 = 3 × 1029 cm2 s−1 for both Iroshnikov–Kraichnan and Kolmogorov turbulence. Similar to the case for a homogeneous gas distribution, our model for the nonhomogeneous gas distribution can also reasonably explain the observed γ-ray flux and intensity radial profile for energies above 400 TeV. According to Table 2, the required acceleration efficiency is 1.6%–3.2% for the nominal kinetic luminosity Lkin = 5 ×1039 erg s−1 of Cygnus X-3. Therefore, our results suggest that the γ-rays with energies above 400 TeV from Cygnus Bubble observed by LHAASO (LHAASO Collaboration 2024) may originate from the μQSH forming around the super-PeVatron microquasar Cygnus X-3, similar to the other five Galactic microquasars reported recently by LHAASO (LHAASO Collaboration et al. 2025).
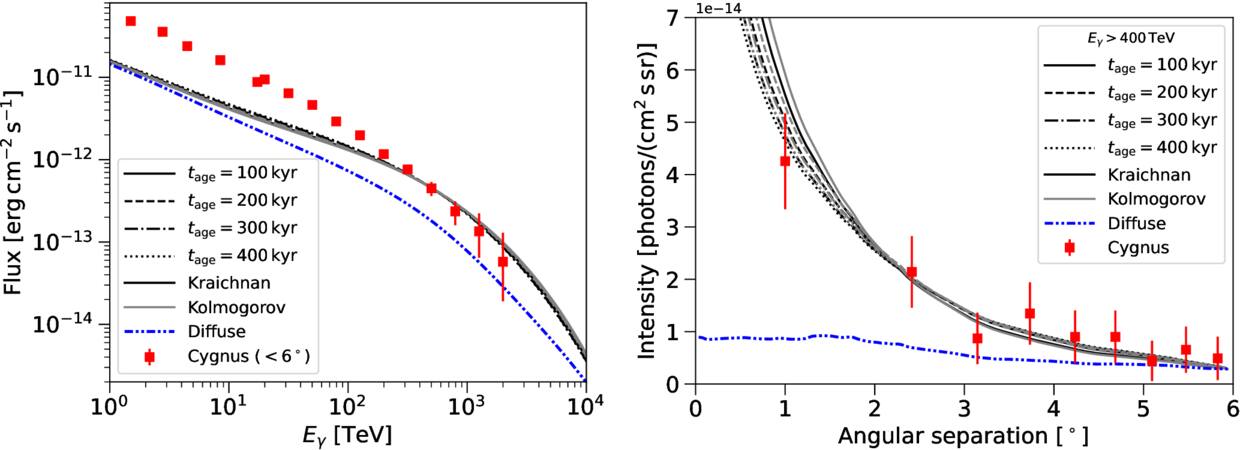
Figure 3. Same as Figure 1, but the right panel displays the azimuthally averaged integrated γ-ray intensity above 400 TeV, and the gas distribution is nonhomogeneous and is given by Equation (12) with n0 = 1 cm−3 and zc = 300 pc, while the CR injection kinetic powers are given in Table 2.
Download figure:
Standard image High-resolution imageTable 2. The CR Injection Kinetic Power for a Nonhomogeneous Gas Distribution
| tage |
 [1037 erg s−1] [1037 erg s−1] | |
|---|---|---|
| (kyr) | Kraichnana | Kolmogorova |
| 100 | 16.0 | 14.4 |
| 200 | 12.0 | 10.4 |
| 300 | 10.4 | 8.8 |
| 400 | 9.6 | 8.0 |
Note. aThe CR injection spectrum is an exponentially cutoff power-law function with the spectral index s = 2.0 and the cutoff energy E0 = 10 PeV, while the minimum proton kinetic energy is  . We have assumed that the gas distribution is nonhomogeneous and is given by Equation (12) with n0 = 1 cm−3 and zc = 300 pc. The diffusion coefficient normalization D0 = 3 × 1029 cm2 s−1 for both Iroshnikov–Kraichnan and Kolmogorov turbulence.
Download table as: ASCIITypeset image
The spatial diffusion coefficient plays a vital role in determining the spatial distribution of CRs, and hence, the resulting γ-ray morphology. Therefore, we discuss it further. The spatial diffusion coefficient in the ISM is D(E =1 GeV) ∼ 3 × 1028 cm2 s−1, based on the investigations on the propagation of CRs in the Galaxy and on the diffuse Galactic γ-ray emission (A. W. Strong et al. 2007). When extrapolating the empirical diffusion coefficient to E = 1 PeV, D(E = 1 PeV) ∼ 3 × 1031 cm2 s−1(3 × 1030 cm2 s−1) for Iroshnikov–Kraichnan (Kolmogorov) turbulence, which is 2 (1) orders of magnitude larger than D0 = 3 × 1029 cm2 s−1 we obtained. Although self-generated turbulence from CR streaming instability can suppress diffusivity around their sources, this suppression is confined to a region of a few tens of parsecs (B. Schroer et al. 2022). On the other hand, strong extrinsic turbulence could be injected by the relativistic jets of Cygnus X-3, producing an extended region of suppressed diffusivity. The spatial diffusion coefficient of CRs according to quasi-linear theory (R. Schlickeiser 1989) for rg < lc is

where c is the speed of light, β the ratio of CR velocity to c, rg = pc/eB = 0.36 pc (pc/PeV)(B/3 µG)−1 the gyroradius of CRs, lc the correlation length of magnetic turbulence, and η = (δB/B)2 the magnetic turbulence level. For rg > lc, D(p) ∝ βp2 (P. Subedi et al. 2017; G. Giacinti et al. 2018; O. Pezzi et al. 2022). The typical correlation length of magnetic turbulence in the interarm regions is 10 pc ≲ lc ≲ 100 pc (M. Haverkorn et al. 2008; J. F. Hollins et al. 2017). In the spiral arms, stellar sources dominate the energy injection for the turbulence cascade, and the typical correlation length is lc ∼ 1 pc (M. Haverkorn et al. 2008). According to M. J. Reid & J. C. A. Miller-Jones (2023), Cygnus X-3 is located in the outer spiral arm. If Cygnus X-3 dominates the turbulence energy injection for the emission region with size R = 1000 pc, and if we assume lc ≃ 1 pc, then according to Equation (18), the turbulence level should be η ∼ 1/10 for D0 = 3 × 1029 cm2 s−1, assuming the magnetic field strength B = 3 µG. In such a situation, however, Equation (18) is not applicable for p > 1 PeV/c. If we assume a larger correlation length lc ≃ 10 pc, Equation (18) is applicable up to p = 10 PeV/c, and the required turbulence level is η ∼ 1/3. Though there are still many uncertainties in our understanding of the interaction between PeV CRs and magnetic turbulence (Y. Hu 2026), the transition of the scattering regime should be incorporated into the modeling of PeV CR propagation, which is not taken into account in the present work.
Finally, we briefly discuss the possibility of whether Cygnus X-3 can account for the γ-ray flux of the 6° radius Cygnus Bubble as observed by LHAASO, not limited to energies above 400 TeV. In order to account for the observed wideband γ-ray flux from 1 TeV to 2 PeV, a soft CR injection spectrum above 1 TeV is needed. Here, we assume an Iroshnikov–Kraichnan turbulence spectrum, i.e., δ = 1/2, and the diffusion coefficient normalization D0 = 3 × 1029 cm2 s−1 as obtained previously. Furthermore, we assume the CR injection duration tage = 1 Myr. In order to fit to the observed flux, as shown in Figure 4, the CR injection spectral index we obtained is s = 2.45, assuming an exponential cutoff energy E0 = 10 PeV. The required CR injection kinetic power above 1 TeV is  , which is about 11% of the kinetic luminosity of Cygnus X-3. If we extrapolate the CR injection spectrum to 1 GeV, then the required CR injection kinetic power above 1 GeV is higher than the kinetic luminosity of Cygnus X-3. However, a harder CR injection spectrum below 1 TeV can not be excluded; thus, the LHAASO observation can not constrain the low-energy spectrum.
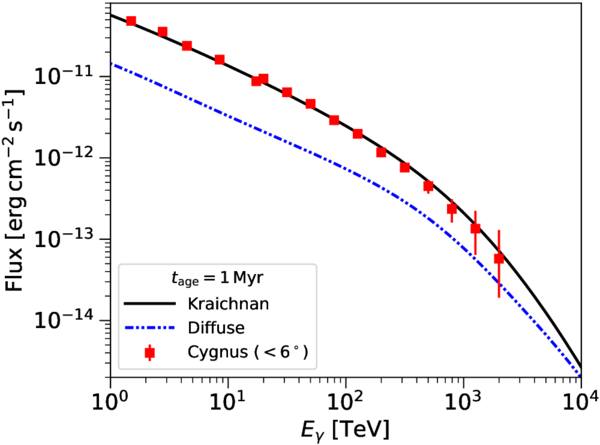
Figure 4. The γ-ray flux from within a 6° radius emission region for Iroshnikov–Kraichnan turbulence (δ = 1/2), assuming that tage = 1 Myr. The black line shows the summation of our model and diffuse Galactic γ-ray fluxes, while the latter is shown by the blue dashed–dotted–dotted line. The red flux points for a 6° radius bubble are taken from LHAASO Collaboration (2024). The diffusion coefficient normalization D0 = 3 × 1029 cm2 s−1, the CR injection spectral index s = 2.45 and its cutoff energy E0 = 10 PeV, the gas distribution is nonhomogeneous and is given by Equation (12) with n0 = 1 cm−3 and zc = 300 pc, and the CR injection kinetic power above 1 TeV is  .
.
Download figure:
Standard image High-resolution image4. Conclusion
In this work, we proposed a simple propagation model, which is based on the diffusion Equation (3), to explain the origin of γ-rays with energies above 400 TeV coming from the direction of Cygnus Bubble reported recently by LHAASO (LHAASO Collaboration 2024) within a region with a radius of 6°. With only a few free parameters, our model can reasonably explain the observed γ-ray flux and integrated intensity radial profile above 400 TeV within the 6° radius region, assuming that CRs are injected continuously by the microquasar Cygnus X-3 for a duration of 100 kyr with an energy spectral index s = 2.0 and an exponential cutoff energy E0 = 10 PeV. The CR spatial diffusion coefficient at E = 1 PeV we obtained is D0 = 3 × 1029 cm2 s−1 for both Iroshnikov–Kraichnan and Kolmogorov turbulence, which is a plausible value in accordance with the quasilinear theory, though the transition of the scattering regime in the magnetic turbulence is not taken into account. Given that the kinetic luminosity of Cygnus X-3 is about Lkin = 5 × 1039 erg s−1 (A. Veledina et al. 2024; J. Wang et al. 2025), our results imply that the CR acceleration efficiency is 0.7%–1.6% (1.6%–3.2%) for the homogeneous (nonhomogeneous) gas distribution assuming a density nH = 1.0 cm−3 (n0 = 1.0 cm−3 with a scale height of 300 pc). Thus, our results suggest that Cygnus X-3, which is capable of accelerating CRs to 10 PeV, can explain UHE photons above 400 PeV coming from the direction of the Cygnus Bubble within a 6° radius region, despite its large distance (d = 9.67 kpc) from the Earth. This scenario presents a unique case where we simultaneously detect both the primary accelerator, Cygnus X-3, and the surrounding “CR halo” formed by the historical accumulation of particles injected by this source into the ISM.
While the UHE emission above 400 TeV is the main focus of this work, the lower-energy (GeV–TeV) emission of the Cygnus Bubble can be treated as foreground radiation from an extended γ-ray source linked to the Cygnus OB2 association. In other microquasars, such as SS 433, V4641 Sgr, and GRS 1915+105, the γ-ray observations have shown that acceleration happens further out in the jet termination shocks (A. U. Abeysekara et al. 2018; H. E. S. S. Collaboration et al. 2024; R. Alfaro et al. 2024; LHAASO Collaboration et al. 2025; A. Acharyya et al. 2026). Our results demonstrate that Cygnus X-3 is among these objects. In this case, Cygnus X-3 would be a “dual” source: the orbitally modulated PeV photons come from the very compact inner region, while the more extended jet termination regions can be responsible for multi-TeV CRs. Instead of just a stellar-wind cavity, the Cygnus Bubble at energies above 400 TeV can be seen as a massive microquasar nebula.
The future deployment of next-generation Imaging Atmospheric Cherenkov Telescopes (IACTs), such as the Cherenkov Telescope Array (CTA; Cherenkov Telescope Array Consortium et al. 2019), the Astrofisica con Specchi a Tecnologia Replicante Italiana (ASTRI; S. Vercellone et al. 2022), and the proposed Large Array of Cherenkov Telescopes (LACT; S. Zhang 2026), will be instrumental in validating the Cygnus X-3 injector hypothesis by providing superior angular resolution (<0 05) in the UHE band. While LHAASO has effectively identified the Cygnus region as a super-PeVatron, its current resolution remains insufficient to fully disentangle the complex line-of-sight superposition between the foreground Cygnus Cocoon and the background Cygnus X-3 environment. IACTs will allow for the spatial resolution of a compact, point-like core at the microquasar’s coordinates and the mapping of energy-dependent morphology, where a shrinking emission size at higher energies would serve as a classic signature of a discrete injector.
Acknowledgments
R.z.Y. is supported by the National Natural Science Foundation of China under grants 12393854 and 12588101, and by the natural science funding of Sichuan Province under grant 2025ZNSFSC0065. R.z.Y. gratefully acknowledges the support of Cyrus Chun Ying Tang Foundations and of the studio of Academician Zhao Zhengguo, Deep Space Exploration Laboratory. F.A. acknowledges the support from Science and Technology Department of Sichuan Province.
Author Contributions
All authors contributed equally.
Footnotes
- 7
For the specific case of α1 + α2 = 2 (for instance, when both CR and gas densities drop as 1/r), the flux becomes
 , which would disfavor a distant source.
