
Abstract
Extragalactic fast X-ray transients (eFXTs) represent a rapidly growing class of high-energy phenomena, whose physical origins remain poorly understood. With its wide-field, sensitive all-sky monitoring, the Einstein Probe (EP) has greatly increased the discovery rate of eFXTs. The search for and identification of the optical counterparts of eFXTs are vital for understanding their classification and constraining their physical origin. Yet, a considerable fraction of eFXTs still lack secure classifications due to the absence of timely follow-up observations. We carry out a systematic search of publicly available optical survey data and transient databases (including the Zwicky Transient Facility and the Transient Name Server) for optical counterparts to eFXT candidates detected by EP. In this paper, we describe our ongoing program and report the first results. Specifically, we identified the eFXT EP240506a to be associated with a UV/optical counterpart, AT 2024ofs. Spectroscopy of its host galaxy with the Very Large Telescope yields a redshift of z = 0.120 ± 0.002. By combining archival survey data with early-time multiwavelength observations, we find that the luminosity and light-curve evolution of AT 2024ofs are consistent with a core-collapse supernova origin. From detectability simulations, we estimate a local event rate density  for EP240506a-like events, and completeness-corrected rate of about 36–78 yr−1 Gpc−3 for EP-detected X-ray transients associated with supernovae. Our results demonstrate the potential of EP to uncover prompt high-energy emission from core-collapse supernovae and underscore the critical importance of timely follow-up of future eFXT events.
Original content from this work may be used under the terms of the Creative Commons Attribution 4.0 licence. Any further distribution of this work must maintain attribution to the author(s) and the title of the work, journal citation and DOI.
1. Introduction
Over the past few decades, advances in wide-field and/or high-sensitivity facilities across the electromagnetic spectrum—from gamma rays to radio—have progressively unveiled the dynamic nature of celestial objects. Some distinct types of transients, including gamma-ray bursts (GRBs) and supernovae (SNe), have been systematically characterized. More recently, newly discovered phenomena such as fast radio bursts, fast blue optical transients (FBOTs), and kilonovae have further expanded the diversity of known astrophysical transients (S. L. Shapiro & S. A. Teukolsky 1983; B. D. Metzger2020; B. Zhang 2019).
In the soft X-ray regime (0.3–10.0 keV), extragalactic fast X-ray transients (eFXTs) represent a class of short-duration X-ray flashes originating at cosmological distances and typically lasting from seconds to several hours. Early manifestations of such events were detected by X-ray monitors on board missions such as BeppoSAX and HETE-II, some of which lacked clear gamma-ray counterparts and were referred to as X-ray flashes (E. Costa et al. 1997; D. Lamb et al. 2004). On the other hand, eFXTs had also been identified through searches of archival data obtained by narrow-field but highly sensitive X-ray telescopes such as Chandra (M. C. Weisskopf et al. 2000; G. Yang et al. 2019; J. Quirola-Vásquez et al. 2022, 2023), XMM-Newton (F. Jansen et al. 2001; D. Alp & J. Larsson 2020), and the X-ray Telescope of the Neil Gehrels Swift Observatory (Swift-XRT; D. N. Burrows et al. 2005; S. Campana et al. 2006; P. A. Mazzali et al. 2008; A. M. Soderberg et al. 2008a). Prior to early 2024, only several dozen eFXTs were known, and their origin remains shrouded in uncertainty due to the lack of timely follow-up observations (G. Yang et al. 2019; D. Alp & J. Larsson2020; J. Quirola-Vásquez et al. 2022, 2023).
Shock breakout (SBO) from core-collapse SNe has long been considered a promising process for producing eFXTs. Two well-established cases in observations are XRO 080109/SN 2008D and the relativistic SBO associated with GRB 060218/SN 2006aj, providing direct evidence that fast X-ray flashes can arise when the shock front emerges from the stellar envelope or from a dense circumstellar medium (S. Campana et al. 2006; P. A. Mazzali et al. 2008; A. M. Soderberg et al. 2008a; E. Nakar & R. Sari 2010; P. Jonker et al. 2013; E. Waxman & B. Katz 2017; J. Deng & X. Wang 2018; D. Alp & J. Larsson 2020; G. Novara et al. 2020; G. Li et al. 2024). Rather than representing distinct classes, these events are thought likely to be part of a continuous zoo of collapsar-related transients, shaped by variations in jet power, viewing angle, progenitor structure, and circumstellar environment. Within this framework, eFXTs may naturally bridge the most luminous long GRBs, softer or off-axis GRBs, and low-luminosity X-ray flashes (B. Zhang & P. Meszaros 2004; E. Nakar 2015; V. D’Elia et al. 2018; B. Zhang 2019; Y. Liu et al. 2025c; J. Quirola-Vásquez et al. 2025). Additional pathways may also contribute to the observed eFXT population, including mildly relativistic cocoons or central-engine-powered X-ray emission following compact-object mergers (B. Zhang 2013; Y. Xue et al. 2019; B. D. Metzger 2020; H. Sun et al. 2025a), and rare tidal disruption events involving white dwarfs and intermediate-mass black holes (P. Jonker et al. 2013; A. Glennie et al. 2015).
This situation has undergone a dramatic shift with the launch of the Einstein Probe (EP; W. Yuan et al. 2022, 2025) in 2024, equipped with an exceptionally wide field of view (∼3600 deg2) and the capability for rapid follow-up observations through the Wide-field X-ray Telescope (WXT; H. Cheng et al. 2025 ) and the Follow-up X-ray Telescope (FXT). In its first 1.5 yr of operation, EP has discovered over 90 eFXTs,29 a fraction of which remain of uncertain origin (Q. Wu et al. 2026, in preparation). Among these, five eFXTs (EP240414a, EP240801a, EP250108a, EP250304a, and EP250827b) have been found to be associated with broad-lined Type Ic (Ic-BL) SNe, opening a new window into unveiling the physical processes governing the death of massive stars (W. Chen et al. 2025b; R. Eyles-Ferris et al. 2025; R. A. J. Eyles-Ferris et al. 2025; H. Hamidani et al. 2025; W.-X. Li et al. 2025b; G. P. Srinivasaragavan et al. 2025a, 2025b; H. Sun et al. 2025b; J. N. D. van Dalen et al. 2025).
However, due to the unknown redshift in some cases, the delay to the rest-frame SN peak, and the uncertain object faintness, SNe detection and confirmation may have been missed by inhomogeneous or limited follow-up efforts. Moreover, for subthreshold events with large position uncertainty that lacked prompt multiwavelength follow-up, their optical counterparts may still be recovered serendipitously in archival or ongoing wide-field optical surveys. In this work, we conduct a systematic search for optical counterparts of EP-detected X-ray transients, aiming to probe the physical origins of these EP-discovered eFXTs.
The detectability of associated SNe varies substantially across the EP sample. For events with sub-10″ localizations, coordinated follow-up campaigns are typically extended for weeks, providing reasonably strong constraints on any underlying SN emission. In contrast, a large fraction of EP events lack precise localizations, leading to follow-up that was sparse, short-lived, or absent altogether. For these poorly localized or subthreshold events, any accompanying SNe—especially those peaking several days after the X-ray trigger or intrinsically faint in the observer frame—could have been easily missed. Nonetheless, for events without prompt multiwavelength observations, their optical counterparts may still be recoverable serendipitously in archival or ongoing wide-field surveys. Motivated by these considerations, we conduct a systematic search for optical counterparts of EP-detected X-ray transients, aiming to probe the physical origins of the growing population of eFXTs discovered by EP.
The paper is organized as follows. In Section 2, we describe the selection criteria for the X-ray and optical samples and outline the cross-matching methodology. Section 3 presents the cross-match results, with Section 3.2 providing a detailed analysis of the newly identified X-ray transient EP240506a/AT 2024ofs. In Section 4, we discuss the probability of chance coincidence and estimate the event rate. Finally, we summarize our results in Section 5.
2. Methodology and Data Selection
2.1. X-Ray Sample
To ensure the completeness of our X-ray sample, we used a list of all high-confidence eFXT candidates (Q. Wu et al. 2026, in preparation) and unverified sources detected by EP between 2024 January 9 and 2025 June 20.
Generally, eFXTs are defined as non-Galactic sources that manifest as nonrepeating, soft X-ray flashes (D. Alp & J. Larsson 2020; J. Quirola-Vásquez et al. 2023). To be included in our high-confidence eFXT candidate sample, a source must satisfy the following criteria based on the method described by Q. Wu et al. (2026, in preparation):
- 1.High significance. The detection signal-to-noise ratio (S/N) must generally exceed 6.0 for ground-based triggers and 7.0 for onboard triggers.
- 2.No X-ray history. There must be no known X-ray source previously detected at the position.
- 3.Not a Galactic origin. The source must not be associated with any known Galactic object, e.g., X-ray binaries, stars.
- 4.Short-duration X-ray flash. The source must exhibit a distinct enhancement in X-ray fluence confined within a single orbit observation (approximately 3.6 ks).
In addition to high-confidence eFXT candidates, we also include unverified sources (subthreshold sources) in our analysis.30 These events are labeled as Unverified during postprocessing, often due to their low S/N, the absence of clear flaring behavior in the light curve, or the lack of prior X-ray detections. Such characteristics suggest that they are likely genuine detections, although their physical nature remains uncertain. In general, unverified sources display realistic point-spread functions (PSFs) and reasonable spectral properties, but their classification is hindered by the relatively large WXT positional uncertainties, which stem from the limited data quality. We include them to avoid missing potential low-S/N eFXT candidates.
After applying these filtering criteria, our selected X-ray sample comprises 95 eFXT candidates and 5140 unverified sources. The sky distribution can be seen in Figure 1.
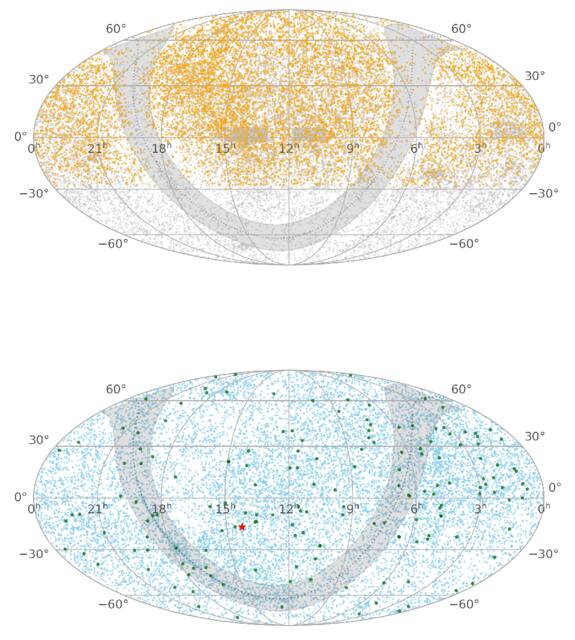
Figure 1. Sky distributions of the samples. The shaded region and the dotted line indicate Galactic latitudes ∣b∣ < 10∘ and the Galactic plane, respectively. Upper panel: optical sample, including TNS objects (gray dots) and ZTF transient candidates (orange dots). Lower panel: unverified sources (blue dots) and high-confidence eFXT candidates (green dots) detected by EP. The red star marks the position of EP240506a.
Download figure:
Standard image High-resolution image2.2. Optical Data Selection
We constructed an initial sample of optical transients by applying a filtering process to the Zwicky Transient Facility (ZTF) alert stream (M. T. Patterson et al. 2018), supplemented with objects reported in the Transient Name Server31 (TNS). To identify extragalactic optical transients, we utilized the Lasair broker system,32 which provides real-time access to ZTF alert data via structured SQL-based queries (R. D. Williams et al. 2024). As part of this process, we leveraged the Sherlock sky context package, an integrated database framework that enables rapid and reliable classification by spatial cross-matching with a wide range of astrophysical catalogs, facilitating efficient selection of transients of interest (D. Young 2023). The optical candidates should satisfy the following criteria:
- 1.The object is either cross-matched with a source in the TNS or has a Sherlock classification label as one of (NT, SN, ORPHAN). These labels correspond to the following categories: (1) transients that fall within the 1
 5 of the core of a resolved galaxy (NT), (2) transients that are not classified as NT but are located within a magnitude-, morphology-dependent radius or are physically separated from a galaxy (SN), and (3) transients that fail to match any known cataloged source (ORPHAN).
 - 2.The object is >2″ away from star-like objects () in the Pan-STARRS (PS) catalog (K. C. Chambers et al. 2016).
- 3.The discovery date reported by TNS is later than 2024 January 9 (UTC), corresponding to the launch date of EP.
- 4.The earliest detection in ZTF is later than 2024 January 9 (UTC).


It is important to note that EP commenced routine observations on 2024 March 1, following the gradual activation of all 48 CMOS modules. Therefore, the selected optical transient sample fully encompasses the temporal window during which associations with X-ray sources could plausibly occur. This filtering strategy enabled the construction of a sample of extragalactic optical transients from the ZTF alert stream. After applying all selection criteria, we identified a total of 12,346 candidates, which form the basis for subsequent multiwavelength cross-matching and analysis. In addition, we incorporated transients reported to the TNS since the launch of EP, resulting in a supplementary sample of 33,048 objects. This sample partially overlaps with the ZTF-selected candidates, thereby improving the overall completeness of our transient catalog. The combined sky distribution of these samples is shown in Figure 1. There is a concentrated region for unverified sources at the Galactic plane between 15h and 19h, attributed to stellar flares and X-ray binaries.
2.3. Cross-matching of X-Ray and Optical Transients
With the compiled catalogs of X-ray and optical transients, we performed a cross-match to identify potential SN candidates exhibiting prompt X-ray emission. For each X-ray source, we identified optical transients residing within the positional uncertainty region of the WXT detection. A conservative matching radius of  was adopted to accommodate potential localization uncertainties, particularly given that the positional accuracy during the early commissioning phase of EP was approximately
  (W. Yuan et al. 2022). Subsequently, we applied a temporal constraint by selecting candidates within a time offset δt, defined as the time difference between the EP detection and the optical discovery. A positive δt indicates that the X-ray detection precedes the optical transient, aligning with the expected sequence for phenomena such as SN SBO. Considering the expected delay between the prompt X-ray emission and the emergence of optical SN signatures (S. Campana et al. 2006; A. M. Soderberg et al. 2008b; F. Förster et al. 2018; W.-X. Li et al. 2025b; H. Sun et al. 2025b), as well as the survey cadence and occasional gaps in optical coverage—which can cause the discovery time to lag behind the true explosion time t0 by missing the early rise or peak—we adopt a conservative matching window of 0 < δt ≤ 30 days. This choice is motivated by the fact that core-collapse SNe typically show rest-frame rise times of tr ≲ 20 days (S. J. Prentice et al. 2016; F. Taddia et al. 2019). For the maximum redshift (∼0.4) of ground-based EP SN discoveries, this corresponds to an observer-frame rise time of tr ≲ 28 days, well within our adopted window.
It is important to note that the candidates identified through this process include not only genuine candidates but also known events (i.e., GRB afterglows), contaminations (i.e., Galactic sources), and chance coincidences. Therefore, a thorough vetting and multiwavelength analysis are essential for assessing the nature of each candidate.
3. Results
3.1. Optical Candidates to X-Ray Sample
After applying the cross-matching procedure described in Section 2, we identified 16 candidates that satisfy our selection criteria: nine high-confidence eFXTs candidates and seven unverified sources, as listed in Tables 1 and 2. Several candidates in our list have been extensively followed up and analyzed in the literature (H. Z. Wu et al. 2024; R. Eyles-Ferris et al. 2025; H. Hamidani et al. 2025; S. Jiang et al. 2025; W.-X. Li et al. 2025b; Y. Liu et al. 2025c; G. P. Srinivasaragavan et al. 2025a; H. Sun et al. 2025b; J. N. D van Dalen et al. 2025; Z. Zhu et al. 2025b). For the remaining events, we carried out case-by-case inspections to evaluate the likelihood of a genuine association. Candidates lacking supporting multiwavelength evidence—such as UV or radio detections—or those coincident with cataloged X-ray sources possessing sub-10″ localizations are attributed to chance coincidence.
Table 1. List of High-confidence eFXTs and Identified Optical Counterpart Candidates
| EP Name | T0 | SX | TNS Name | Classification | Separation | δt | References |
|---|---|---|---|---|---|---|---|
| (arcmin) | (days) | ||||||
| EP240315a | 2024-03-15 18:27:18 | 28.88 | AT 2024eju | GRB | 0.91 | 1.086 | Y. Liu et al. (2025c); A. J. Levan et al. (2024) |
| EP240414a | 2024-04-14 09:49:10 | 11.23 | AT 2024gsa | SN | 1.54 | 0.125 | H. Sun et al. (2025b); J. N. van Dalen et al (2025) |
| EP240425a | 2024-04-25 20:49:24 | 8.34 | AT 2024ocl | Unknown | 0.89 | 8.593 | Q. Zhao et al. (2026, in preparation) |
| EP240506a | 2024-05-06 05:01:39 | 7.80 | AT 2024ofs | SN candidate | 2.95 | 7.719 | D. Y. Li et al. (2024) |
| EP241030a | 2024-10-30 06:33:18 | 9.01 | AT 2024zuk | GRB | 1.25 | 0.435 | H. Z. Wu et al. (2024) |
| EP250108a | 2025-01-08 12:47:35 | 6.27 | SN 2025kg | SN | 0.31 | 0.970 | R.-Z. Li et al. (2025a); R. A. J. Eyles-Ferris et al. (2025) |
| EP250226a | 2025-02-26 06:35:16 | 7.74 | AT 2025dbz | GRB | 0.48 | 3.373 | S. Jiang et al. (2025) |
| EP250304a | 2025-03-04 01:32:30 | 14.58 | AT 2025fhm | SN | 0.82 | 0.825 | W. Chen et al. (2025b) |
| EP250427a | 2025-01-08 12:47:35 | 6.27 | AT 2025inn | GRB | 0.31 | 0.970 | Y. Wang et al. (2025) |
Note. The format of EP name for each high-confidence X-ray transient follows EPYYMMDDx, where x, starting with “a,” indicates the order in which the event was reported on that date. T0 denotes the trigger time for confirmed X-ray transients. SX represents the WXT detection significance (W. Yuan et al. 2022).
Download table as: ASCIITypeset image
Table 2. List of Unverified Sources and Identified Optical Counterpart Candidates
| EP Name | T0 | SX | TNS Name | Classification | Separation | δt |
|---|---|---|---|---|---|---|
| (arcmin) | (days) | |||||
| EPW20240326aa | 2024-03-24 08:00:27 | 5.27 | AT 2024fkr | Unverified | 0.72 | 9.052 |
| WXT J1212+1004 | 2024-03-28 19:31:39 | 5.63 | AT 2024fyr | Unverified | 3.13 | 5.502 |
| WXT J113313−003848 | 2025-04-18 03:18:39 | 5.05 | AT 2025kbw | Unverified | 3.02 | 5.514 |
| WXT J071516+592950 | 2025-02-03 17:45:39 | 5.09 | AT 2025ccx | Unverified | 2.29 | 16.261 |
| WXT J154218−072742 | 2025-04-30 23:46:13 | 5.06 | AT 2025lph | Unverified | 1.48 | 19.357 |
| WXT J1454+1837 | 2024-05-02 16:02:29 | 5.28 | AT 2024ode | Unverified | 1.49 | 6.864 |
| WXT J160346+193555 | 2024-06-11 01:28:15 | 5.59 | AT 2024loi | Unverified | 0.29 | 2.349 |
Note. T0 denotes the observation start time for unverified sources.
Download table as: ASCIITypeset image
We conclude that none of the unverified sources are of extragalactic origin: WXT J160346+193555 is likely associated with a cataclysmic variable (CV), while the remaining six candidates are consistent with temporal or spatial coincidences (see Appendix A), and therefore fall outside the scope of this study. In addition to the well-studied eFXTs, we highlight EP240506a, which appears to be an orphan event: despite extensive multiwavelength follow-up during the first few days, only upper limits were obtained. Remarkably, it is spatially and temporally associated with the optical transient AT 2024ofs, which was reported on TNS approximately 19 days after the EP trigger. We also identify prior UV emission at ∼2 days and early optical emission at ∼8 days post-trigger. Given this temporal offset, the chance-coincidence probability estimated in Section 4 is Pcc ∼ 3 × 10⁻⁴, strongly suggesting that the association is genuine rather than a random alignment. The WXT image and the position of AT 2024ofs are shown in Figure 2. Following a comprehensive analysis of archival data and the properties of its host galaxy, as detailed below, we confirm that EP240506a is associated with the SN candidate AT 2024ofs. This makes EP240506a another EP-detected eFXT linked to an SN.
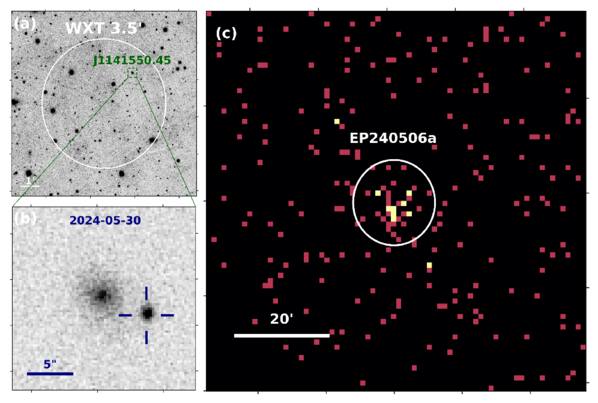
Figure 2. Localization of EP240506a and its optical counterpart AT 2024ofs. (a) The position of the host galaxy J141550.45 (green outline) relative to the WXT localization uncertainty (white circle) in the PS r-band image. (b) The PS w-band science image, where the position of AT 2024ofs is marked by a cross, showing that the transient lies in the outskirts of its host galaxy. (c) The WXT X-ray image obtained from T0 to T0 + 150 s. The white circle denotes the source extraction region with a radius of  .
.
Download figure:
Standard image High-resolution image3.2. Observations and Analysis of EP240506a/AT 2024ofs
In this section, we present the observations and analysis of the newly discovered SN candidate EP240506a/AT 2024ofs.
3.2.1. X-Ray/γ-Ray Detection
EP240506a was discovered by WXT in the 0.5–4 keV band at 05:01:39 UTC on 2024 May 6, during the commissioning phase of EP (D. Y. Li et al. 2024). The WXT data were processed with wxtpipeline, an analysis chain of the WXT Data Analysis Software (WXTDAS) developed by the EP Science Center. The transient was detected with a significance of 7.8, which was below the onboard trigger33
threshold of 8.0 at that time, and therefore no automatic follow-up observations were triggered; the latter are essential for capturing the rapid decay phase. Nevertheless, it was reported via the VHF Alert (W. Yuan et al. 2022), with a sky position of R.A. = 14h 15m 56 88, decl. = −16° 14′ 16
 8 (J2000), with position uncertainty of 3
 5.
5.
The flare, however, was missed in the default telemetry data as it occurred shortly after the passage through the South Atlantic Anomaly (SAA) and was truncated. The data were subsequently recovered by rerunning the pipeline manually, yielding an event exhibiting a duration of  and a peak flux of ∼1 × 10⁻⁸ erg cm−2 s−1 and total 36.8 ± 6.5 photons, as seen in the light curve shown in Figure 3. T90 is defined as the time during which the central 90% of the fluence is observed. The derived X-ray peak luminosity is (2.3 ± 0.6) × 1047 erg s−1 in the WXT 0.5–4.0 keV band at z = 0.12 (see Section 3.2.4). The burst spectrum can be fitted by an absorbed power-law model with a photon index of Γ = 0.85 ± 0.44, assuming a fixed Galactic hydrogen column density of NH = 9.24 × 1020 cm−2 (R. Willingale et al. 2013). The corresponding averaged unabsorbed flux is estimated to be (1.61 ± 0.41) × 10−9 erg cm−2 s−1 and corresponding averaged luminosity is (6.45 ± 1.65) × 1046 erg s−1. As shown in Figure 4, the X-ray luminosity of EP240506a significantly exceeds that of XRO 080109 and is comparable to GRB 060218, EP250108a, and EP240414a, implying the energy falls into the regime of relativistic SBO.
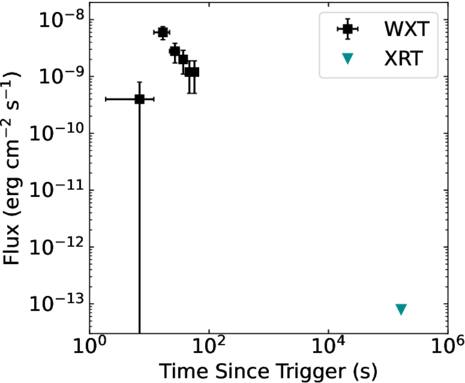
Figure 3. The 0.5–4.0 keV light curve of EP240506a in the observer frame. The XRT flux is converted to 0.5–4 keV and is shown as a cyan triangle. The WXT data are binned with a time resolution of 10 s.
Download figure:
Standard image High-resolution image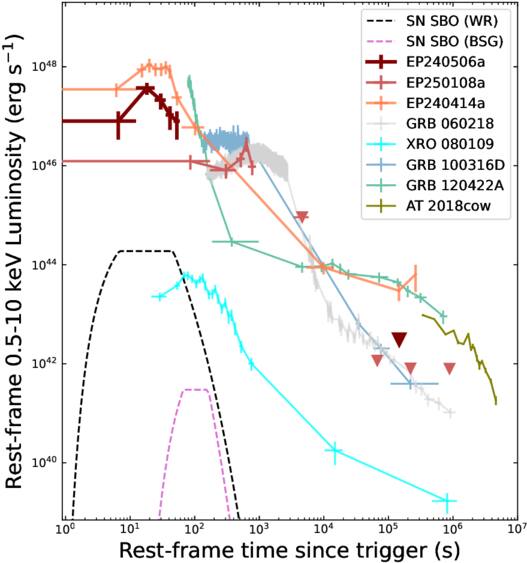
Figure 4. Evolution of the rest-frame X-ray luminosity of EP240506a, compared with those of EP240414a (H. Sun et al. 2025b) and EP250108a (W.-X. Li et al. 2025b). The WXT count rates have been converted to 0.5–10 keV luminosities using the best-fit absorbed power-law model derived in Section 3.2.1, adopting z = 0.12 (see Section 3.2.4). Upper limits are shown as triangles. For comparison, we include the X-ray light curves of the low-luminosity GRBs 060218 (S. Campana et al. 2006), 100316D (R. Starling et al. 2011), and 120422A (S. Schulze et al. 2014), obtained from the Swift-BAT and XRT data via the Burst Analyser (P. Evans et al. 2010), with K-corrections applied using their time-resolved spectral fits. The dashed curves show the predicted shock-breakout luminosities for a Wolf–Rayet (WR) progenitor (M = 15 M⊙, R = 5 R⊙, κ = 0.2) and a blue supergiant (BSG) progenitor (M = 15 M⊙, R = 50 R⊙, κ = 0.34), following E. Nakar & R. Sari (2010).
Download figure:
Standard image High-resolution imageA Swift follow-up observation commenced at 02:45:40 UTC on 2024 May 8, approximately 45 hr after the EP trigger, yielding a total exposure of 2.59 ks. No uncataloged X-ray source was detected within the 3 5 EP/WXT error circle. Assuming the best-fit absorbed power-law model derived for the prompt emission, we estimate a limiting flux of 7.9 × 10⁻¹⁴ erg cm−2 s−1 in the 0.5–4 keV band, calculated using the HEASARCWebPIMMS tool (K. Mukai 1993).
Although the sky position of the transient was visible to Fermi-GBM, no significant signal was detected within the time interval T0 ± 100 s. By combining the nondetection from Fermi-GBM down to ∼7 × 10⁻⁸ erg cm−2 s−1 (assuming α = −0.85 and β = −2.3) with the flux measured by WXT, and assuming the spectrum follows a Band function, we constrain the peak energy to Epeak < 140 keV and derive an isotropic-equivalent energy of Eiso < 9.3 × 1049 erg, again adopting z = 0.12 (see Section 3.2.4). The derived upper limits on the peak energy and isotropic-equivalent energy fall within the region where type I and type II GRBs overlap on the Amati relation (L. Amati et al. 2002). However, these limits rule out a large portion of the parameter space typically occupied by type I GRBs, providing meaningful constraints despite the remaining ambiguity.
3.2.2. UV/Optical/Near-IR Observations
Analysis of the initial Swift/UVOT target-of-opportunity (ToO) data show a marginal UVM2-band excess at the position of the optical counterpart, measured at 22.57 ± 0.43 mag (S/N = 2.5) in a 903.8 s exposure (Figure 5(a)), with a 5σ limiting magnitude of >21.59 mag. This potential new detection, which has not previously been reported, lies near the sensitivity limit of the observation and may be affected by background fluctuations. To evaluate its reliability, we conducted a series of follow-up Swift ToO observations between 2025 May 20 and 2025 June 24. A stacked UVM2-band image constructed with uvotimsum (total exposure of 2181.5 s) achieved a 5σ limiting magnitude of >22.31 but revealed no significant emission at the position of AT 2024ofs (Figure 5(b)). The absence of persistent emission in the deeper template suggests that the earlier excess, if real, was transient in nature; however, given its low significance, the possibility of a spurious fluctuation cannot be excluded. Nonetheless, we adopt this measurement in our analysis owing to its temporal and spatial consistency with the optical counterpart.
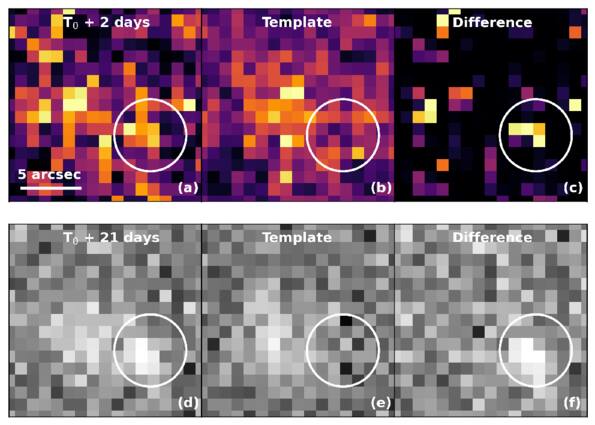
Figure 5. UVM2 and r-band imaging of AT 2024ofs. Panels (a)–(c) show the Swift/UVOT UVM2 data: (a) the image obtained during the 2024 ToO observation, (b) the deeper template image taken in 2025, and (c) the difference image, displayed with a squared intensity scale. Panels (d)–(f) show ZTF g-band imaging: (d) the science image containing the transient, (e) the template image acquired on 2024 May 8, and (f) the corresponding difference image. The position of AT 2024ofs is indicated by a white circular aperture of 3″ radius. All images are centered on the host galaxy.
Download figure:
Standard image High-resolution imageDespite extensive follow-up campaigns within the first 3 days after the EP trigger, no optical/IR counterpart was identified (A. Aryan et al. 2024, 2025; N. Chang et al. 2024; J. J. Jin et al. 2024; N. Pankov et al. 2024; I. Perez-Garcia et al. 2024; S. Tinyanont et al. 2024). However, nearly two weeks later, a new optical transient, AT 2024ofs/ZTF24aaowcoo, was independently discovered by ZTF and PS within the 3 5 localization uncertainty of the WXT detection (K. C. Chambers et al. 2024). The transient is spatially coincident with the UVOT source and shows a fading trend in the ZTF forced-photometry light curve (see below; F. J. Masci et al. 2023).
From Figure 2(b), AT 2024ofs is offset by 5 32 from the galaxy SDSS J141550.45−163937.0 (hereafter J141550.45), consistent with a location in the galaxy’s halo region. To further assess its origin, we revisited archival observations from multiple facilities—including ZTF, ATLAS, PS, GROND, Thai Robotic Telescope (TRT), and Small & Light Telescope (SLT), and the Xinglong 2.16 m telescope (XLT)—and compiled them to reconstruct the evolution of the optical light curve of AT 2024ofs. An even earlier signal was revealed in ATLAS forced photometry at 7.7 days after the WXT trigger.
To improve the photometric quality, we employed the Forced Photometry Service (F. J. Masci et al. 2023) for ZTF data between T0 + 13 days (MJD 60450.27), when the transient initially emerged on the subtracted ZTF image, and T0 + 28 days (MJD 60464.27), which significantly enhanced the accuracy of the light curves. For the ATLAS light curves, we used the publicly available ATClean34 package (S. Rest et al. 2023, 2025) to retrieve the forced photometry from the ATLAS forced photometry35 server (L. Shingles et al. 2021) and clean it following the recipe described by S. Rest et al. (2025). For PS data, photometric monitoring started on MJD 60460.327, 24.1 days after the discovery of EP240506a. The images were obtained in the w filter (J. L. Tonry et al. 2012). Images were processed with the Image Processing Pipeline (E. A. Magnier et al. 2020a; C. Z. Waters et al. 2020), astrometrically and photometrically calibrated (E. A. Magnier et al. 2020b), and individual frames were coadded with median clipping to produce stacks, on which PSF photometry was performed (E. A. Magnier et al. 2020c). In addition, we coadded PS images taken around T0 + 35.8 days (MJD 60472), yielding a clear detection of the transient at w = 21.83 ± 0.15 mag using AutoPhOT. The source subsequently faded and was not detected in later epochs.
The sky position of AT 2024ofs was also observed as part of our J-band follow-up of EP240506a using the 7-channel imager GROND (J. Greiner et al. 2008) mounted on the MPG 2.2 m telescope at ESO’s La Silla Observatory. The observation was carried out on 2024 May 9 at UT 05:02, corresponding to 72 hr after the EP discovery. Image differencing was performed using the AutoPhOT pipeline (S. J. Brennan & M. Fraser 2022), with a J-band image from the VISTA Hemisphere Survey36 obtained in 2012 May serving as the reference. No source was detected at the target position, with 5σ limiting Vega magnitudes of J > 19.1, H > 18.3, and K > 17.3.
The 40 cm SLT at the Lulin Observatory was utilized to obtain images in the Sloan Digital Sky Survey r filter as part of the Kinder collaboration (T.-W. Chen et al. 2025a). We coadded 30 × 300 s images from SLT, reaching a 3σ limiting magnitude of ∼22 in the r band.
The collected light curve is presented in Figure 6, which we contrast against the light curves of SN Ibn and SN Ibc templates, as well as the prototypical FBOT AT 2018cow and Ic-BL SN 2024gsa associated with EP240414a. The evolution of AT 2024ofs exhibits distinct features relative to these classes: it shows a longer rise time but a comparable postpeak decay rate to AT 2018cow and SNe Ibn, along with a lower peak luminosity. Compared to typical SNe Ibc (as well as SN 2024gsa), it evolves more rapidly, indicating that AT 2024ofs belongs to a class of intermediate-timescale transients rather than representing the extremes of either rapidly evolving or normal stripped-envelope SNe.
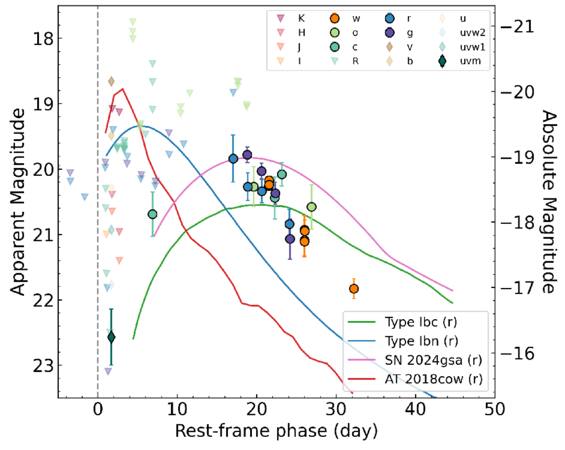
Figure 6. Optical light curve of AT 2024ofs compared with r-band template absolute-magnitude light curves at z = 0.12: SN Ibc (green; A. Levan et al. 2005; M. R. Drout et al. 2011), SN Ibn (blue; G. Hosseinzadeh et al. 2017), FBOT AT 2018cow (red; D. A. Perley et al. 2019), and Ic-BL SN 2024gsa (violet; H. Sun et al. 2025b). The gray dashed line represents the WXT trigger time of EP240506a.
Download figure:
Standard image High-resolution image3.2.3. Multiwavelength Fitting
The observed data were corrected for a line-of-sight Galactic extinction of E(B − V) = 0.106 mag (D. J. Schlegel et al. 1998). The UV detection was excluded from the fit because it deviates significantly from the model light curve (see Figure 7) as well as its low S/N, and because the fitting framework may not be applicable at such early epochs.
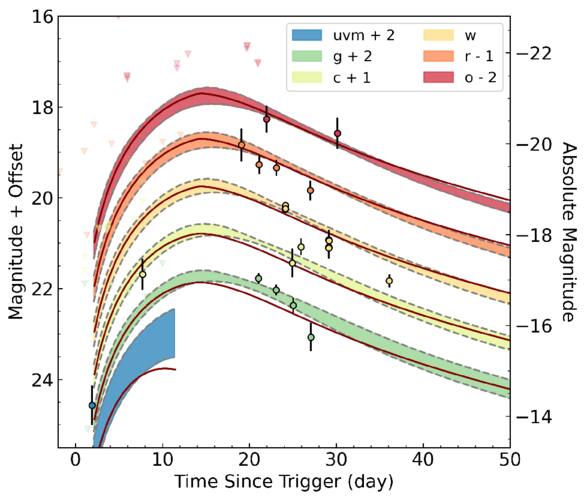
Figure 7. Multiband optical light curves of AT 2024ofs compared with the best-fit Arnett model. Observed photometric data with error bars are shown together with the 90% credible intervals of the model predictions (shaded regions). The UVM2-band data and corresponding model prediction are also shown to illustrate the deviation at early times. The red curves represent a model with parameters MNi = 0.8 M⊙, Mej = 2.5 M⊙, and vej = 1.6 × 10⁴ km s−1. Different filters are indicated by distinct colors and vertical offsets for clarity, where nondetections are plotted as triangles. The left axis denotes apparent magnitudes, while the right axis shows the corresponding absolute magnitudes.
Download figure:
Standard image High-resolution imageWe modeled the rest of the multiwavelength light curve of AT 2024ofs using the semianalytical Arnett model (W. D. Arnett 1982) as implemented in the Redback package37 (N. Sarin et al. 2024). The model assumes homologous ejecta expansion, with heating powered by the radioactive decay of 56Ni and 56Co, while photon diffusion regulates the emergent luminosity (W. D. Arnett 1982). Bayesian inference was performed via nested sampling with dynesty38 (J. S. Speagle 2020), using a likelihood function that incorporates both detections and nondetections. The analysis highlights the sparse temporal coverage—particularly the lack of photometry around peak luminosity—which produced poorly constrained posteriors. Although the model broadly reproduces the observed light curves (Figure 7), the inferred parameters drift toward unphysical regions of parameter space, as illustrated in Figure 10 in Appendix C.
For context, we compare our results with ejecta properties inferred for other SNe associated with eFXTs detected by EP (H. Sun et al. 2025b; W.-X. Li et al. 2025b), which indicate 56Ni masses of ∼0.8 M⊙ and relatively high MNi/Mej ratios. Assuming this 56Ni mass, the expected peak bolometric absolute magnitude is  , which is consistent with our observations (J. D. Lyman et al. 2016). Motivated by these studies, we fixed the 56Ni mass to a plausible value and allowed other parameters to vary within reasonable ranges, ensuring that the model predictions remained broadly consistent with the limited data. While this approach yields a qualitative description of the event, it should not be regarded as unique or statistically robust.
The optical light curves are reasonably reproduced by a radioactive-decay-powered model, yielding an ejecta mass of Mej ≈ 2.5 M⊙, vej = 1.6 × 10⁴ km s−1, and kinetic energy of  . The photospheric velocity at peak light, vsc, and the peak bolometric luminosity, Lpeak ≈ 2.3 × 1043 erg s−1, are inferred from the fitted parameters. These values are broadly consistent with those of similar events, although the adopted 56Ni mass is higher than that of typical stripped-envelope SNe. However, it remains compatible with the yields of energetic Type Ic-BL SNe given the high peak luminosity, supporting the interpretation that the emission was primarily powered by 56Ni and 56Co decay (S. Campana et al. 2006; A. M. Soderberg et al. 2008a; J. D. Lyman et al. 2016; S. J. Prentice et al. 2016; F. Taddia et al. 2019; R.-Z. Li et al. 2025a; H. Sun et al. 2025b).
Nonetheless, these estimates remain subject to large uncertainties because of the sparse temporal sampling and the absence of spectroscopy for AT 2024ofs. Future events with denser photometric coverage and prompt spectroscopy will be crucial for placing robust constraints on explosion mechanisms and energy sources.
3.2.4. Host Galaxy
To determine the redshift of EP240506a/AT 2024ofs, we obtained a long-slit spectrum of its host galaxy with FORS2 on the ESO Very Large Telescope (VLT) (UT1) at Paranal on 2025 April 26 (Program ID: 115.287Q.002, PI: Ling-Zhi Wang). The data were processed with the ESO Reflex workflow (W. Freudling et al. 2013) using standard procedures (bias subtraction, flat-fielding, wavelength calibration, and sky subtraction). The flux calibration was performed by applying a scaling factor to match the photometric measurements, as the spectroscopic extraction encompassed only a fraction of the flux from this extended source. The host-galaxy spectrum exhibits a continuum with prominent emission features, including Hα and [N II], as shown in Figure 8. By fitting the emission lines, we derived a redshift of z = 0.120 ± 0.002. We then performed full spectral fitting using the method of N. Li et al. (2020). Prior to fitting, all detected emission lines were carefully masked following the procedure outlined by C. Li et al. (2005). Our fitting employs the simple stellar population (SSP) models of G. Bruzual & S. Charlot (2003), which comprise 1326 SSPs spanning 221 ages from 0 to 20 Gyr and six metallicities from Z = 0.005 Z⊙ to Z = 2.5 Z⊙. These models are based on the Padova evolutionary tracks (G. Bertelli et al. 1994) and a G. Chabrier (2003) stellar initial mass function. From this fitting, we derive a dust attenuation of the host galaxy of E(B − V) = 0.19.
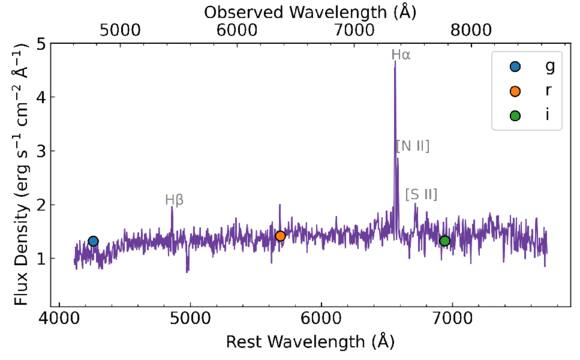
Figure 8. Optical spectrum of the host galaxy. The flux calibration was performed using photometric measurements from the Legacy Survey, shown as colored dots. Prominent emission lines employed for redshift measurement are indicated with gray labels.
Download figure:
Standard image High-resolution imageAssuming the cosmological parameters from the Planck Collaboration (2020), the luminosity distance and angular-diameter distance to the host galaxy are 578.5 and 461.2 Mpc, respectively. Given an angular offset of 5 32, the projected physical separation between EP240506a/AT 2024ofs and the center of its host galaxy is estimated to be 11.9 kpc.
We also estimated the probability of a chance coincidence between AT 2024ofs and J141550.45. Using the apparent r-band magnitude of 18.2 mag from the Legacy Survey and the angular separation of 5 32, we derived a chance-coincidence probability of Pch = 4.8 × 10⁻³ following the method of J. S. Bloom et al. (2002). Such a low probability suggests that the association between the SN and the galaxy is unlikely to be a random alignment.
3.3. Probability of Chance Coincidence
Our search for optical counterparts to eFXT candidates yields more than ten matches. However, the relatively large localization uncertainties of WXT imply that a substantial fraction of these associations are consistent with chance alignments, which dominate the contamination. Quantifying the rate of chance coincidences (i.e., false associations) is therefore essential for estimating the expected number of genuine counterparts as the sample size increases.
To evaluate the likelihood of an X-ray–optical match arising from chance coincidence (Pcc), we construct a mock sample of optical transients by resampling the discovery dates from the real optical sample in Section 2 and applying a random positional offset within an annulus with inner and outer radii of 3 5 and 1∘, to prevent true association in our simulation. This approach introduces spatial and temporal randomness while preserving the underlying sky and time distributions. We then performed one-dimensional Kolmogorov–Smirnov (KS) tests on the distributions of discovery date and sky position (tdis, R.A., decl.) for the real and mock samples. The null hypothesis that the two samples are drawn from the same distribution could not be rejected, with p-values well above 0.05 (corresponding to a 90% confidence level).
We estimate Pcc via 200 Monte Carlo simulations (P. Munar-Adrover et al. 2011; G. S. Vance et al. 2021; Y.-F. Wang et al. 2022). In each simulation, we randomly select 500 X-ray sources (≈10% of the full EP eFXT candidate catalog) and cross-match them with the mock optical sample following the procedure described in Section 2. We define Pcc as the fraction of X-ray sources that yield at least one counterpart in the mock optical sample. By varying the temporal offset threshold δt, we derive Pcc(δt) for both the full eFXT candidate sample and the subset of high-confidence events, as shown in Figure 9.
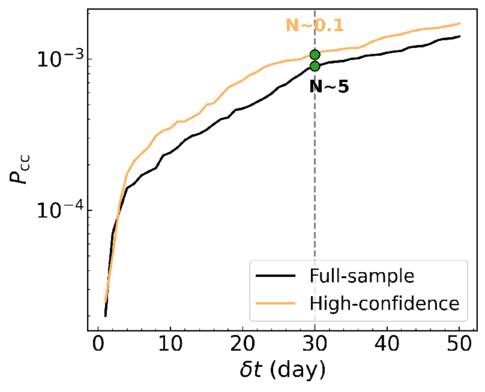
Figure 9. Pcc versus time offset δt for the full EP eFXT candidate sample (black) and the high-confidence eFXT candidate subsample (orange). The vertical dashed line marks δt = 30 days, the threshold adopted in this work. The green dots denote the expected random matches at δt = 30 days.
Download figure:
Standard image High-resolution imageThe lower Pcc inferred for the full eFXT candidate sample is primarily driven by the inclusion of X-ray sources located near the Galactic plane: because the mock optical transients are distributed predominantly at high Galactic latitude, the effective sky overlap is reduced, leading to a lower chance-coincidence rate (see Figure 1). Adopting δt = 30 days, the expected number of random matches is ∼5, fully consistent with the seven unrelated associations identified in this work (see Section 3.1 and Appendix A).
For the subset of high-confidence eFXTs, we estimate an expected number of random associations of only ∼0.1 at δt = 30 days. These events generally exhibit much shorter X-ray–optical time delays—typically within ten days—owing to rapid multiwavelength follow-up efforts. Such prompt observations substantially suppress the probability of spurious positional and temporal coincidences.
4. Discussion
Here, we discuss the implications of the discovery of the optical counterpart of EP240506a and the estimation of the local event rate for EP240506a-like events.
The discovery of EP240506a/AT 2024ofs illustrates how SN-associated eFXTs can be missed in real time, even when the association is clear in hindsight. The event significance (S/N = 7.8) fell just below the onboard trigger threshold, preventing an automated FXT follow-up and the acquisition of a precise X-ray localization within the first day. Although dedicated follow-up observations were conducted within the first ∼3 days, no optical counterpart was detected, likely owing to the delayed and relatively slow optical rise of the SN. Without an early detection to motivate continued monitoring, the optical rise and peak were entirely missed. This case highlights how coarse localizations and short-lived follow-up can obscure SN counterparts to eFXTs, even for nearby and intrinsically luminous events.
More broadly, EP240506a/AT 2024ofs supports the emerging picture that a population of low-luminosity or cocoon-powered collapsars contributes to the EP eFXT sample, tracing a continuum between classical long GRBs and ordinary core-collapse SNe. This discovery underscores the importance of rapid X-ray localization and sustained optical monitoring for fully characterizing this population.
To place EP240506a-like events in a broader population context, we estimate the local event rate density of eFXTs analogous to EP240506a following H. Sun et al. (2015). The local event rate density can be expressed as

where N is the number of detected events, ΩWXT = 3600 deg2 is the field of view of EP/WXT, η ≃ 0.5 is the duty cycle (H. Sun et al. 2025b), and TOT ≃ 1.5 yr is the time span covered by our search.  represents the maximum volume within which the event can be detected,

The comoving volume is given by

with ![$E(z)={[{{\rm{\Omega }}}_{{\rm{M}}}{(1+z)}^{3}+{{\rm{\Omega }}}_{{\rm{\Lambda }}}]}^{1/2}$](https://content.cld.iop.org/journals/0004-637X/999/2/239/revision1/apjae41b1ieqn20.gif) for a flat ΛCDM cosmology (Planck Collaboration 2020). Here f(z) is the redshift-dependent evolution of star formation history (H. Yüksel et al. 2008) and DL is the luminosity distance at the corresponding redshift. Based on redshifted light-curve simulations, an EP240506a-like event with a peak X-ray luminosity of (2.3 ± 0.6) × 1047 erg s−1 would be detectable by WXT out to
for a flat ΛCDM cosmology (Planck Collaboration 2020). Here f(z) is the redshift-dependent evolution of star formation history (H. Yüksel et al. 2008) and DL is the luminosity distance at the corresponding redshift. Based on redshifted light-curve simulations, an EP240506a-like event with a peak X-ray luminosity of (2.3 ± 0.6) × 1047 erg s−1 would be detectable by WXT out to  at an S/N of 7. This implies a local event rate density of
  , where the uncertainties represent the 1σ Poisson limits (N. Gehrels 1986).
As of 2025 June, four EP transients have been associated with SNe—EP240414a, EP240506a, EP250108a, and EP250304a (W. Chen et al. 2025b; W.-X. Li et al. 2025b; H. Sun et al. 2025b; Y. Zhang et al. 2025). By combining these events (H. Sun et al. 2022), we estimate the local event rate density of EP-discovered SNe as about 12–26 yr−1 Gpc−3. Accounting for the fact that roughly one-third of high-confidence eFXTs currently have reliable redshift measurements (B. O'Connor et al. 2025; Q. Wu et al. 2026, in preparation), we obtain a completeness-corrected rate of 36–78 yr−1 Gpc−3. This inferred rate is orders of magnitude below the core-collapse supernova rate of (6.88 ± 0.078) × 104 yr−1 Gpc−3 (X. Ma et al. 2025), and is broadly consistent with the rates estimated for EP250108a (W.-X. Li et al. 2025b) and for the population of low-luminosity GRBs ( ; H. Sun et al. 2015).
5. Conclusion
In this work, we conduct a systematic all-sky search for optical counterparts to a selected X-ray sample from EP, consisting of high-confidence eFXT candidates and unverified sources identified by EP/WXT. The search adopts the following matching criteria: (1) spatial separation <3 5 and (2) temporal offset between the X-ray and optical detections δt ≤ 30 days.
Applying these criteria, we identify optical counterpart candidates for nine high-confidence eFXT candidates and seven unverified sources. The majority of the high-confidence eFXTs are associated with either GRBs or supernovae that have been well studied. Within this sample, we uncover one previously unrecognized EP–SN association, EP240506a.
AT 2024ofs is a newly identified SN candidate associated with the eFXT event EP240506a, which has a duration of  and a peak X-ray luminosity of (2.3 ± 0.6) × 1047 erg s−1. No UV/optical counterpart had been previously reported for this event. The Swift/UVOT ToO data taken two days after the eFXT event revealed a low-significance detection (Figure 5(c)). AT 2024ofs was identified in optical imaging 7.8 days after the X-ray trigger at the same position as the UV source. Given the very low likelihood of chance alignment, we adopt AT 2024ofs as the optical counterpart to EP240506a.
Using VLT/FORS2, we measured a spectroscopic redshift of z = 0.12 for the host galaxy from prominent Hα and [O iii] emission lines. The corresponding luminosity and angular-diameter distances are DL = 578.5 and DA = 461.2 Mpc, respectively.
We compiled archival multiwavelength photometric data for EP240506a/AT 2024ofs from initial follow-up observations and surveys, including ZTF, ATLAS, PS, GROND, XLT, TRT, and SLT. The combined light curve can be broadly reproduced by a radioactive decay model with 56Ni mass ∼0.8 M⊙, ejecta mass Mej = 2.5 M⊙, vej = 1.6 × 10⁴ km s−1, consistent with those of EP240414a/SN 2024gsa and EP250108a/SN 2025kg. Nevertheless, the uncertainties remain substantial, underscoring the need for future events with denser photometric sampling and timely spectroscopic observations to robustly constrain their physical origins.
We estimate the local volumetric event rate density for EP240506a-like transients. By simulating its light curve, we derive a maximum detectable redshift of  at an S/N of 7, corresponding to an event rate density of
  . If EP240506a arises from the core collapse of a massive star, combining this event with other EP-detected SN-associated transients yields a rough completeness-corrected population rate of 36–78 yr−1 Gpc−3.
Our results underscore the importance of systematic, multiwavelength counterpart searches for EP-discovered transients, which are essential for establishing the nature of individual events and building a well-characterized eFXT population. While EP/WXT enables wide-field discovery, EP/FXT—despite its smaller field of view (∼1deg2)—probes an observable volume of ∼10% that of WXT owing to its higher sensitivity, and provides superior localization accuracy (∼10″) and spectral quality. Real-time counterpart searches and prompt multiwavelength follow-up observations are critical for fully exploiting the scientific potential of EP.
Acknowledgments
This work is based on data obtained with the Einstein Probe (EP), a space mission supported by the Strategic Priority Program on Space Science of the Chinese Academy of Sciences (CAS), in collaboration with the European Space Agency (ESA), the Max-Planck-Institute for Extraterrestrial Physics (MPE, Germany), and the Centre National d’Études Spatiales (CNES, France).
W.X.L. is supported by the National Natural Science Foundation of China (NSFC; grants 12120101003, 12233008, and 12373010), the National Key R&D Program of China (2022YFA1602902 and 2023YFA1607804), and the Strategic Priority Research Program of CAS (XDB0550100 and XDB0550000). L.Z.W. is supported by NSFC grant 12573050 and in part by CAS through a grant to the Chinese Academy of Sciences South America Center for Astronomy (CASSACA). L.Z.W., W.X.L., N.C.S., E.T., J.S.H., F.E.B., and J.C. are supported by the CASSACA Key Research Project (E52H540301).
M.N. acknowledges support from the European Research Council (ERC) under the European Union’s Horizon 2020 research and innovation program (grant agreement No. 948381). A.A. and T.-W.C. acknowledge support from the Ministry of Education Yushan Fellow Program (MOE-111-YSFMS-0008-001-P1) and the National Science and Technology Council of Taiwan (NSTC 114-2112-M-008-021-MY3). F.E.B. and E.T. acknowledge funding from ANID through CATA BASAL (FB210003) and FONDECYT Regular grants 1241005 and 1250821.
H.S. acknowledges support from NSFC (grant 12573049) and the Young Elite Scientists Sponsorship Program by the China Association for Science and Technology (YESS20240218). S.Y. is supported by NSFC grant 12303046, the Startup Research Fund of the Henan Academy of Sciences (242041217), and the Joint Fund of the Henan Province Science and Technology R&D Program (235200810057).
Part of the funding for GROND (both hardware and personnel) was provided by the Leibniz Prize awarded to Prof. G. Hasinger (DFG grant HA 1850/28-1). The VISTA Hemisphere Survey data products served at Astro Data Lab are based on observations collected at the European Organisation for Astronomical Research in the Southern Hemisphere (ESO) under program 179.A-2010, and/or data products derived from these observations. This work is based on observations made with the Thai Robotic Telescope under program ID TRTToO 2024002, which is operated by the National Astronomical Research Institute of Thailand (Public Organization).
Facilities: EP - (Einstein Probe), Swift - Swift Gamma-Ray Burst Mission (XRT and UVOT), Fermi-GBM - , VLT - , Max Planck:2.2m - Max Planck Gesellschaft 2.2 meter Telescope at European Southern Observatory (GROND - ).
Software: astropy (Astropy Collaboration et al. 2013), Numpy (C. R. Harris et al. 2020), Matplotlib (J. D. Hunter 2007).
Appendix A: Details of Candidates
Here we provide details of the discovery and identification of the matched candidates listed in Tables 1 and 2.
A.1. EP240315a
EP240315a was discovered by EP/WXT at 20:10:44 UTC on 2024 March 15, with a duration of T90,X = 1034 s. The gamma-ray counterpart, GRB 240315C, was subsequently detected by Swift’s Burst Alert Telescope (BAT) and Konus-Wind 372 s after the initial WXT trigger. The optical counterpart, AT2024eju, was identified by ATLAS approximately 1.1 hr later. Spectroscopy established a redshift of z = 4.859, indicating that EP/WXT captured the soft X-ray prompt emission of a high-redshift GRB (J. H. Gillanders et al. 2024; A. J. Levan et al. 2024; Y. Liu et al. 2025c).
A.2. EP240414a
EP240414a was discovered by EP/WXT at 09:49:10 UTC on 2024 April 14, and no contemporaneous gamma-ray signal was detected. The optical counterpart, SN 2024gsa, was subsequently identified in the luminous host galaxy SDSS J124601.99−094309.3 and classified as (Ic-BL) SN. The light curve of SN 2024gsa exhibits a distinctive multibump evolution. The observed soft X-ray spectrum and luminosity at z = 0.401 suggest that EP240414a originated from the interaction of a weak relativistic jet with an extended envelope surrounding the progenitor star (H. Hamidani et al. 2025; H. Sun et al. 2025b; J. N. D. van Dalen et al. 2025).
A.3. EP240425a
EP240425a was discovered by EP/WXT at 20:50:33 UTC on 2024 April 25, with no prompt gamma-ray signal detected. A rapidly fading optical counterpart was subsequently identified, while the radio emission continued to brighten for ≳170 days. In the absence of a reliable redshift measurement, the physical origin of the transient cannot be established definitively. Nevertheless, the observed multiwavelength behavior is broadly consistent with expectations for a jetted tidal disruption event (Q. Zhao et al. 2026, in preparation).
A.4. EP240506a
EP240506a was triggered via the VHF EP/WXT alert channel at 05:01:39 UTC on 2024 May 6 during the commissioning phase of EP. However, as it did not activate the BeiDou alert system, no automated follow-up observations were initiated, resulting in a missed decay phase of the transient. The transient lasted for approximately 50 s, reaching a peak flux of 1 × 10⁻⁸ erg s−1 cm−2 (D. Y. Li et al. 2024). No counterpart was identified in the immediate follow-up observations (A. Aryan et al. 2024; N. Chang et al. 2024; J. J. Jin et al. 2024; N. Pankov et al. 2024; I. Perez-Garcia et al. 2024; S. Tinyanont et al. 2024). In this work, we find that the event is probably associated with an SN (AT 2024ofs). Spectroscopic observation of its host galaxy yields a redshift of z = 0.12. Further details of EP240506a are discussed in Section 3.2.
A.5. EP241030a
EP241030a was detected by EP/WXT at 06:33:18 UTC on 2024 October 30, with a duration of approximately 50 s. The event was found to be spatially and temporally coincident with GRB 241030A, and was subsequently identified as its X-ray afterglow counterpart (H. Z. Wu et al. 2024). The prompt gamma-ray emission was observed earlier by Fermi-GBM and Swift-BAT at 05:48:03 UTC on the same day, about 45 minutes before the EP detection (N. Klingler et al. 2024; Fermi GBM Team 2024). A bright optical counterpart was also detected by Swift-UVOT, and follow-up spectroscopic observations with Keck/LRIS measured a redshift of z = 1.411 (W. Zheng et al. 2024).
A.6. EP250108a
EP250108a was discovered by EP/WXT at 12:30:28.34 UTC on 2025 January 8, with no significant gamma-ray counterpart detected (R.-Z. Li et al. 2025a). The optical counterpart, SN 2025kg, was identified through follow-up observations, although no associated radio emission was observed (T. An et al. 2025; R. Eyles-Ferris 2025; R. A. J. Eyles-Ferris et al. 2025; L. Izzo 2025; G. Schroeder et al. 2025; Z. Zhu et al. 2025b; X. Zou et al. 2025). Subsequent spectroscopic analysis classified SN 2025kg as a Type Ic-BL SN, originating from the core collapse of a Wolf–Rayet star at redshift z = 0.176 (W.-X. Li et al. 2025b; D. Xu et al. 2025; Z. Zhu et al. 2025b). Further investigations suggest that the observed X-ray emission likely arose from the interaction between a mildly relativistic outflow and the surrounding circumstellar material (W.-X. Li et al. 2025b; G. P. Srinivasaragavan et al. 2025a; J.-P. Zhu et al. 2025a; Z. Zhu et al. 2025b).
A.7. EP250226a
EP250226a was triggered by EP/WXT at 06:35:16 UTC on 2025 February 26, followed by automatic FXT observations. The event was associated with GRB 250226A, which had been detected by Fermi-GBM, Konus-Wind, Swift-BAT, and GECAM-B. The EP X-ray detection occurred about 20 s after the Fermi-GBM trigger (Fermi GBM Team 2025; S. Jiang et al. 2025). An optical counterpart was subsequently identified using the VLT, and spectroscopic observations determined a redshift of z = 3.315 (Z. Zhu et al. 2025c).
A.8. EP250304a
EP250304a was discovered by EP/WXT at 01:32:30 UTC on 2025 March 4, with a duration of approximately 1200 s (W. Chen et al. 2025b; Y. Zhang et al. 2025). An optical counterpart was detected about 1.12 hr after the WXT trigger (X. Liu et al. 2025a). Subsequent spectroscopic observations with the VLT measured a redshift of z = 0.2 and classified the transient as a Type Ic-BL SN (L. Izzo et al. 2025; A. Saccardi et al. 2025a). This makes EP250304a the third SN associated with an eFXT detected by EP.
A.9. EP250427a
EP250427a was detected by EP/WXT at 03:38:45 UTC on 2025 April 27. The true onset time (T0) remains unconstrained, as the satellite was within the SAA region prior to the trigger. The event is associated with a subthreshold burst, GRB 250427A, detected by Fermi-GBM (M. Ravasio et al. 2025; Y. Wang et al. 2025). An optical counterpart was detected 4 hr after trigger (X. Liu et al. 2025b; I. Perez-Garcia et al. 2025). Spectroscopic observations conducted with Keck/LRIS and VLT/X-Shooter confirmed a redshift of z = 1.52 (R. Chornock et al. 2025; A. Saccardi et al. 2025b).
A.10. EPW20240326aa
EPW20240326aa was initially flagged as a transient due to a prominent flare lasting approximately 104 s, accompanied by apparent periodic oscillations. However, this source was later determined to be spurious, likely caused by background fluctuations, as similar patterns were observed across other CMOS detectors. Consequently, it was reclassified as an unverified source attributed to the potential of instrumental background variations.
A.11. WXT J160346+19355
WXT J160346+19355 was identified as an unverified source, exhibiting a relatively steady X-ray flux over several days, followed by nondetections. There is a historical X-ray source 2CXO J160346.6+193540 in the Chandra Source Catalog. The position of the corresponding optical object, as reported by Gaia and suggested to be a brightening CV, is spatially consistent with the known CV CRTS CSS160906 J160346+193540 and 2CXO J160346.6+193540. We conclude that the X-ray emission and the optical counterpart might originate from the same source. The detections on those days were made possible by ultralong effective exposures of ∼2 × 10⁴ s, accumulated during the instrument calibration phase.
A.12. Others
Based on the large position uncertainties of WXT and low signal-to-noise ratios, the remaining unverified sources are likely attributable to chance spatial and temporal coincidences, given the marginal significance of their X-ray detections and the absence of follow-up observations or any corroborating evidence supporting a physical association.
Appendix B: Multiwavelength data of EP240506a/AT 2024ofs
The UV/optical/IR photometric measurements of EP240506a/AT 2024ofs are summarized in Table 3.
Table 3. Multiwavelength Photometry of EP240506a/AT 2024ofs
| Phase | Telescope | Band | Mag. |
|---|---|---|---|
| (days) | |||
| 1.203 | TRT | I | >21.0 |
| 1.232 | TRT | R | >21.6 |
| 1.428 | XLT | g | >23.10 |
| 1.909 | Swift/UVOT | uvw2 | >21.77 |
| 1.909 | Swift/UVOT | uvm2 | 22.57 ± 0.43 |
| 1.909 | Swift/UVOT | u | >20.29 |
| 1.909 | Swift/UVOT | v | >18.66 |
| 1.909 | Swift/UVOT | b | >19.49 |
| 1.909 | Swift/UVOT | uvw1 | >20.93 |
| 2.704 | ATLAS | c | >19.68 |
| 2.707 | ATLAS | c | >19.69 |
| 2.724 | ATLAS | c | >19.66 |
| 3.004 | GRONDa | H | >18.3 |
| 3.004 | GRONDa | J | >19.1 |
| 3.009 | GRONDa | K | >17.3 |
| 3.698 | ATLAS | c | >19.71 |
| 3.702 | ATLAS | c | >19.70 |
| 3.709 | ATLAS | c | >19.68 |
| 3.711 | ATLAS | c | >19.65 |
| 3.720 | ATLAS | c | >19.69 |
| 3.721 | ATLAS | c | >19.60 |
| 3.756 | ATLAS | c | >19.57 |
| 4.922 | ATLAS | o | >18.01 |
| 4.927 | ATLAS | o | >17.90 |
| 4.930 | ATLAS | o | >17.75 |
| 5.948 | ATLAS | o | >19.39 |
| 5.955 | ATLAS | o | >19.34 |
| 5.968 | ATLAS | o | >19.31 |
| 6.712 | ATLAS | c | >19.47 |
| 7.720 | ATLAS | c | 20.69 ± 0.34 |
| 11.675 | ATLAS | o | >19.05 |
| 11.678 | ATLAS | o | >19.15 |
| 12.951 | ATLAS | o | >18.84 |
| 19.086 | ZTF | r | 19.84 ± 0.36 |
| 19.726 | ATLAS | o | >18.73 |
| 19.734 | ATLAS | o | >18.67 |
| 19.750 | ATLAS | o | >18.66 |
| 20.979 | ATLAS | o | >19.02 |
| 20.983 | ATLAS | o | >19.05 |
| 21.064 | ZTF | g | 19.78 ± 0.12 |
| 21.133 | ZTF | r | 20.27 ± 0.21 |
| 21.981 | ATLAS | o | 20.27 ± 0.30 |
| 23.084 | ZTF | g | 20.03 ± 0.12 |
| 23.127 | ZTF | r | 20.34 ± 0.18 |
| 24.118 | Pan-STARRS | w | 20.26 ± 0.04 |
| 24.129 | Pan-STARRS | w | 20.19 ± 0.05 |
| 24.140 | Pan-STARRS | w | 20.17 ± 0.06 |
| 24.152 | Pan-STARRS | w | 20.24 ± 0.06 |
| 24.953 | ATLAS | c | 20.44 ± 0.32 |
| 25.043 | ZTF | g | 20.37 ± 0.17 |
| 25.928 | ATLAS | c | 20.08 ± 0.18 |
| 27.024 | ZTF | r | 20.84 ± 0.22 |
| 27.065 | ZTF | g | 21.07 ± 0.31 |
| 29.123 | Pan-STARRS | w | 21.09 ± 0.23 |
| 29.133 | Pan-STARRS | w | 21.11 ± 0.23 |
| 29.146 | Pan-STARRS | w | 20.93 ± 0.22 |
| 29.157 | Pan-STARRS | w | 20.95 ± 0.17 |
| 30.129 | ATLAS | o | 20.58 ± 0.34 |
| 36.097 | Pan-STARRS | w | 21.83 ± 0.15 |
Note. aGROND magnitudes are obtained in the Vega system and calibrated using REFCAT2 sources in the field of view.
Appendix C: Model Fitting of AT 2024ofs
We present the posterior distributions obtained from the Bayesian inference of the AT 2024ofs light curve using the Arnett model implemented in Redback, as shown in Figure 10. The inferred parameters—including fNi, vej, and Tfloor—exhibit strong degeneracies and tend to drift toward the boundaries or unphysical regions of the parameter space.
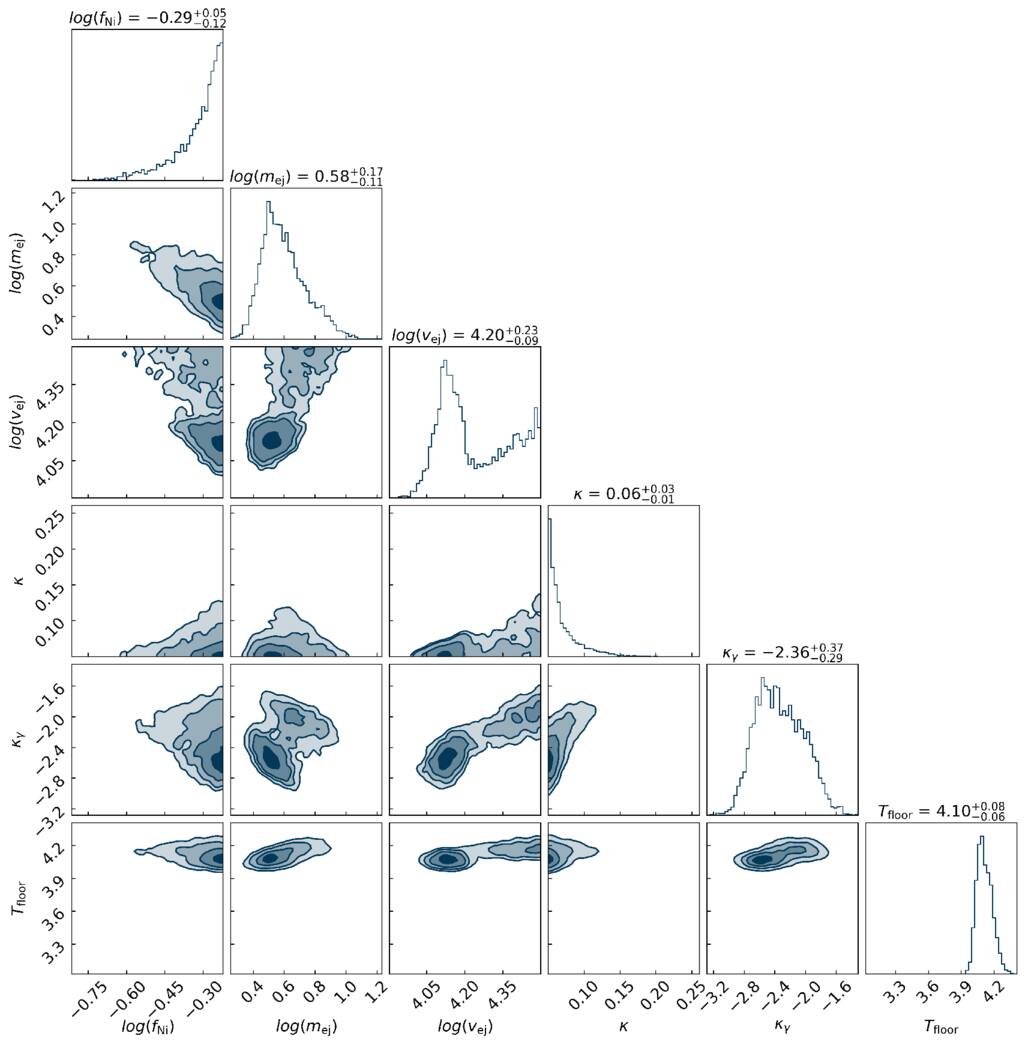
Figure 10. Corner plot of the posterior distributions from the Arnett-model light-curve fitting of AT 2024ofs. The notation “log” denotes the base-10 logarithm. The free parameters are:  —the mass fraction of radioactive 56Ni,
  —the ejecta mass,
  —the characteristic ejecta velocity, κ—the gray opacity of the ejecta, κγ—the gamma-ray opacity, and Tfloor—the temperature floor.
Download figure:
Standard image High-resolution imageFootnotes
- 29
The final eFXT catalog of Q. Wu et al. (2026, in preparation) contains fewer sources than earlier GCN/ATel reports, as some candidates were later identified as other source classes or deemed non-genuine.
- 30
Their signal-to-noise ratios typically lie in the range between 5.0 and 6.0. The subthreshold catalog will be published later.
- 31
- 32
- 33
BeiDou is the Chinese satellite navigation system. Alert data—including source coordinates, flux, spectral hardness ratio, and in some cases a simple light curve—are downlinked to the ground segment with a latency of ∼10 minutes. In addition, the CNES (France) VHF network, developed for the Chinese–French SVOM mission and operating with a lower trigger threshold of 5.0, is used through collaboration to enhance the alert capability and enable the transmission of more extensive quick-look transient data (W. Yuan et al. 2022).
- 34
- 35
- 36
- 37
- 38