
Abstract
We present the number density of massive ( ) quiescent galaxies at 2 < z < 5 using JWST NIRSpec PRISM spectra. This work relies on spectra from RUBIES, which provides excellent data quality and an unparalleled, well-defined targeting strategy to robustly infer physical properties and number densities. We identify quiescent galaxy candidates within RUBIES through principal component analysis and construct a final sample using star formation histories derived from spectrophotometric fitting of the NIRSpec PRISM spectra and NIRCam photometry. By inverting the RUBIES selection function, we correct for survey incompleteness and calculate the number density of massive quiescent galaxies at these redshifts, providing the most complete spectroscopic estimates prior to cosmic noon to date. We find that early massive quiescent galaxies are surprisingly common (≳10−5 Mpc−3 by 4 < z < 5), which is consistent with previous studies based on JWST photometry alone and/or in smaller survey areas. We compare our number densities with predictions from six state-of-the-art cosmological galaxy formation simulations. At z > 3, most simulations fail to produce enough massive quiescent galaxies, suggesting the treatment of feedback and/or the channels for early efficient formation are incomplete in most galaxy evolution models.
Original content from this work may be used under the terms of the Creative Commons Attribution 4.0 licence. Any further distribution of this work must maintain attribution to the author(s) and the title of the work, journal citation and DOI.
1. Introduction
How the most massive galaxies stopped forming stars (“quenched”) remains one of the most important but mysterious questions in galaxy evolution. Evidence suggests that massive quiescent galaxies (M* > 1011 M⊙) are already in place in the first ∼1 Gyr after the Big Bang (e.g., A. C. Carnall et al. 2024; A. de Graaff et al. 2025b; A. Weibel et al. 2025). The efficient formation channel for these early galaxies is heavily debated (e.g., B. Liu & V. Bromm 2022; A. Dekel et al. 2023; A. Ferrara et al. 2023). Certain mechanisms must be triggered in these quiescent systems to rapidly shut down their previously efficient star formation, despite the fact that cosmic star formation density is rising in this epoch (e.g., P. Madau & M. Dickinson 2014). Common speculations of these mechanisms include feedback from compact star formation (e.g., A. M. Diamond-Stanic et al. 2012; P. H. Sell et al. 2014) or from active galactic nuclei (AGN; e.g., D. J. Croton et al. 2006; A. C. Fabian 2012). These processes are capable of exhausting the central cool gas reservoir that fuels the star formation in galaxies, by either removing them mechanically through outflows, heating them to disrupt gravitational collapse, or preventing further gas accretion from the cosmic environment (e.g., R. Bezanson et al. 2019; K. E. Whitaker et al. 2021; C. C. Williams et al. 2021; S. Belli et al. 2024; F. D’Eugenio et al. 2024). Historically, these mechanisms are incorporated into simulations to recreate the observed galaxy populations (e.g., R. G. Bower et al. 2006; D. J. Croton et al. 2006; D. Sijacki et al. 2007; C. D. P. Lagos et al. 2008; R. S. Somerville et al. 2008).
Since the launch of the JWST (J. P. Gardner et al. 2006, 2023), tremendous progress has been made in selecting candidates of high-redshift (z > 3) massive quiescent galaxies (e.g., A. C. Carnall et al. 2023a; F. Valentino et al. 2023) as well as in confirming them spectroscopically (e.g., A. C. Carnall et al. 2024; T. Nanayakkara et al. 2024; A. de Graaff et al. 2025b). As these quenched objects are dominated by older stellar populations of high mass-to-light ratios, we can mitigate systematic bias in stellar mass estimation due to outshining from young (<100 Myr old) stellar populations (e.g., C. Giménez-Arteaga et al. 2023; C. Papovich et al. 2023). Moreover, the number densities of these massive quiescent systems in the early Universe can place valuable constraints on our models of galaxy evolution (e.g., G. De Lucia et al. 2024; C. d. P. Lagos et al. 2024), which are mostly calibrated to observations at later times (e.g., R. S. Somerville & R. Davé 2015). Constrained by the age of the Universe when these early massive quiescent galaxies are observed, their inferred star formation histories (SFHs) implies high or even close-to-theoretical-limit (A. C. Carnall et al. 2024; K. Glazebrook et al. 2024; A. de Graaff et al. 2025b; C. Turner et al. 2025) baryon conversion efficiency in the early dark-matter halos, implying extreme formation efficiency. Alternatively, studies have explored how modifying inference assumptions—such as the initial mass function (IMF; e.g., P. van Dokkum & C. Conroy 2024) and abundance patterns (e.g., M. Park et al. 2025; A. G. Beverage et al. 2025)—can mitigate the inferred extreme stellar masses and reconstructed SFHs.
Several studies have attempted to probe the number densities of the quiescent population at the earliest possible time, using photometrically selected candidates from the early JWST imaging fields (e.g., A. C. Carnall et al. 2023a; F. Valentino et al. 2023; S. Alberts et al. 2024; A. S. Long et al. 2024; W. M. Baker et al. 2025b). However, the classical photometric rest-frame color selection techniques utilized successfully at z < 2 (e.g., R. J. Williams et al. 2009; K. E. Whitaker et al. 2011) face various issues at z > 3. First, photometry alone is not sufficient to break the age–dust degeneracy, which compromises the purity of color-selected quiescent samples, especially when the wavelength coverage is limited to NIRCam filters (λ < 4.4 μm; e.g., J. Antwi-Danso et al. 2023). Second, early color selections miss the youngest (mean stellar age < 300 Myr) quiescent galaxies, which become more common at z > 3 (e.g., S. Belli et al. 2019; M. Park et al. 2024; W. M. Baker et al. 2025a). Expanded color selections have been motivated to include younger quiescent galaxies (e.g., S. Belli et al. 2019; W. M. Baker et al. 2025a). Nevertheless, the ranges of these new photometric criteria and the available wavelength sampling create a patchwork of poorly understood selection effects and interloper populations, which could be driving the high variance in abundances measured between different surveys. Finally, photometric rest-frame colors will always be sensitive to systematic uncertainties due to photometric redshifts, which depend on the nature of the photometry.
Deep near-infrared (NIR) spectroscopy can more robustly confirm the quiescent nature of these high-redshift candidates. But most studies thus far have been limited to single objects or targeted follow-up of small samples (e.g., A. C. Carnall et al. 2023b, 2024; K. Glazebrook et al. 2024; M. Onoue et al. 2025; A. de Graaff et al. 2025b; A. Weibel et al. 2025). To date, only a few sizable spectroscopic samples have attempted to constrain the number density of quiescent galaxies, finding largely consistent statistics as photometric studies. W. M. Baker et al. (2025a) assembled a spectroscopic sample by combining multiple early JWST observing programs. However, fully characterizing the selection function of such a sample is challenging due to the wide range of selection criteria that saw these sources placed on slits. Spectroscopic follow-up can be used to assess the purity of photometric samples; T. Nanayakkara et al. (2025) estimated ∼80% purity of their photometric parent sample, which could then be used to update initial number density estimates (C. Schreiber et al. 2018). However, given that the photometric sample utilizes the classical rest-frame UVJ color selection, this is likely an underestimate at z > 3 (e.g., J. Antwi-Danso et al. 2023; A. S. Long et al. 2024). M. Park et al. (2024) attempted a less direct but complementary method and measured the number density of quiescent galaxies at z > 3 by reconstructing the formation histories of a spectroscopic sample of quiescent galaxies observed at lower redshifts z ∼ 2 (M. Park et al. 2024). However, this approach is sensitive to the choice of model assumptions (A. C. Carnall et al. 2019; J. Leja et al. 2019a; K. A. Suess et al. 2022; M. Park et al. 2025) and will likely underestimate the true number densities due to progenitor bias. Finally, all early estimates of high-redshift galaxy number densities are limited by the relatively small field of view of JWST. Therefore, cosmic variance sets a floor on the precision of this measurement (e.g., ∼20%, for a combined area of  ; F. Valentino et al. 2023).
These early studies of quiescent galaxy number densities at face value indicate an overabundance of quiescent galaxies at z > 3 compared to predicted values from six state-of-the-art cosmological galaxy formation simulations (e.g., C. d. P. Lagos et al. 2025). Given that tension exists relative to all models despite the wide variation in the implementation of the AGN feedback needed to quench massive galaxies, additional model development may be needed. However, given the known limitations in the observational measurements (e.g., due to sample purity, contamination, or cosmic variance), we must also demonstrate that this discrepancy is not caused by imprecise observational results. Thus, as we make this comparison between observed and predicted number densities, all observational studies must strive to identify quiescent galaxies that are fully representative of the full population over the largest possible area.
In this paper, we present a spectroscopic census of massive quiescent galaxies at 2 < z < 5 over a cosmologically relevant volume. This work relies on data collected from the JWST Red Unknowns: Bright Infrared Extragalactic Survey (RUBIES; GO#4233, PIs: A. de Graaff and G. Brammer; A. de Graaff et al. 2025a) Program. RUBIES is an NIRSpec (T. Böker et al. 2023) microshutter array (MSA) survey that spans color space and aims to provide a census of the reddest high-redshift sources. The well-characterized selection function (in empirical color–magnitude space) and high completeness for rare high-redshift objects of RUBIES allow us to robustly estimate the quiescent galaxy number density, despite the rare nature of the population. We identify quiescent galaxy candidates within the RUBIES dataset from their rest-frame optical to NIR spectral energy distributions (SEDs) using principal component analysis (PCA; similar to V. Wild et al. 2014). We then perform spectrophotometric stellar population synthesis modeling to finalize a robust sample of massive quiescent galaxies.
The paper is organized as follows. In Section 2, we describe the spectroscopic and imaging data used in our analysis. We detail the identification of quiescent galaxies, including PCA and spectrophotometric modeling, in Section 3. We compare our selection to conventional rest-frame color selection methods and account for targeting selection and incompleteness in Section 4. In Section 5, we present the number density of massive quiescent galaxies in our sample, which we compare to literature results from both observations and simulations. We summarize our findings in Section 6. Throughout this paper, we assume a flat ΛCDM cosmology with ΩΛ = 0.69, Ωm = 0.31, and H0 = 67.66 km s−1 Mpc−1 as reported in Planck Collaboration et al. (2020). We adopt a Chabrier IMF (G. Chabrier 2003).
2. Data
2.1. RUBIES NIRSpec/Microshutter Assembly Spectroscopy
The JWST/NIRSpec Spectroscopy used in this work is taken from the RUBIES program (GO#4233, PIs: A. de Graaff and G. Brammer; A. de Graaff et al. 2025a). RUBIES targets two extragalactic legacy fields: the Extended Groth Strip (EGS) and Ultradeep Survey (UDS), which are parts of the Cosmic Assembly NIR Deep Extragalactic Legacy Survey (N. A. Grogin et al. 2011; A. M. Koekemoer et al. 2011). The parent photometric catalog from which the RUBIES targets were selected was created using public JWST/NIRCam mosaic imaging of EGS from the Cosmic Evolution Early Release Science (CEERS) survey (M. B. Bagley et al. 2023; S. L. Finkelstein et al. 2023, 2025) and in UDS from the Public Release Imaging for Extragalactic Research (PRIMER; C. T. Donnan et al. 2024). RUBIES prioritizes sources that are red in color (F150W − F444W > 2), bright (F444W < 27), or have high photometric redshifts (zphot > 6.5), which were computed with EAZY (G. B. Brammer et al. 2008). The parent photometric catalog of RUBIES was derived by merging public catalogs that are available on the DAWN JWST Archive (DJA) and was visually inspected to remove invalid entries due to artifacts or pipeline errors. This catalog is used for the completeness correction described in Section 4.3.
All RUBIES spectra used in this work were reduced with msaexp23 (G. Brammer 2023a), corresponding to version 3 of NIRSpec data (described in detail in A. de Graaff et al. 2025a) released on DJA24 (A. de Graaff et al. 2024; K. E. Heintz et al. 2025). In brief, uncalibrated exposures were taken from the Mikulski Archive for Space Telescopes (MAST)25 and processed through the Detector1Pipeline steps of the standard JWST pipeline, where a mask was inserted for large cosmic-ray snowball events (J. Rigby et al. 2023) calculated with snowblind (J. Davies et al. 2024) and a 1/f correction was applied. After individual slits are identified, the 2D unrectified spectra are flat-fielded and flux calibrated. Generally, RUBIES spectra are reduced with two different background subtraction strategies. However, not all RUBIES spectra have robust spectroscopic redshift quality (grade 3 as defined in A. de Graaff et al. 2025a) in both reduction versions. In one version, the sky background is removed “locally” by taking image differences of the 2D spectra taken at the three spacecraft nod offset positions. Additionally, a second version of RUBIES spectrum reduction was implemented with a global sky subtraction, where a global background is obtained by interpolating spectra from empty slits over the survey footprint and then subtracted from each source spectrum given its spatial location. The global background subtraction version is recommended for bright extended sources. The massive quiescent galaxies that this project aims to search for are bright and expected to be resolved. For any RUBIES spectra included in this analysis (see Section 3.1 for selection criteria), we adopt the global subtraction where available (535 sources), defaulting to local background subtraction for eight sources. Once background subtracted, 1D spectra were optimally extracted (K. Horne 1986) from the rectified 2D spectra (detailed description is available in K. E. Heintz et al. 2025). Finally, using the a priori source position within the shutter and assuming an azimuthally symmetric Gaussian profile, an effective extended-source path-loss correction for light outside the slitlet for each source is derived and applied to the spectrum.
Although this work focuses on the NIRSpec/PRISM spectra as they provide homogeneous coverage of spectral information that constrains the stellar population modeling at 2 < z < 5, we note that RUBIES also collected NIRSpec G395M spectra (2.9–5.3 μm; R ∼ 1000) for these sources. The inclusion of G395M spectra in stellar population synthesis modeling is left for future studies.
2.2. NIRCam Photometry in the EGS and UDS
The RUBIES photometric targeting catalog was not measured from point-spread function (PSF)-matched NIRCam images and is therefore not optimal for further scientific analysis. For further analysis, we utilize public PSF-matched photometry catalogs of EGS and UDS.26
These catalogs were created with NIRCam F115W, F150W, F200W, F277W, F356W, F410M, and F444W mosaic images of EGS and UDS fields from CEERS and PRIMER (for UDS/PRIMER, the catalog also includes F090W) that are reduced with grizli (G. Brammer 2023b), corresponding to version 7.2 on DJA (F. Valentino et al. 2023). These mosaic images have pixel scales of 0 04 pixel−1. All sources were first detected from a long-wavelength sky-subtracted noise-equalized F277W + F356W + F444W stack image, using the Python library for Source Extraction and Photometry (SEP; K. Barbary 2016). Then, PSFs were empirically built in each band, following R. E. Skelton et al. (2014) and K. E. Whitaker et al. (2019), and PSF-matching kernels were produced using Pypher (A. Boucaud et al. 2016) and convolved to degrade all NIRCam images to F444W resolution. Finally, aperture photometry was extracted using circular apertures with SEP (E. Bertin & S. Arnouts 1996; K. Barbary 2016). These aperture fluxes were corrected to total based on each object’s circularized Kron radius and PSF size. A detailed description of photometric catalog construction can be found in J. R. Weaver et al. (2024a). We note that the public versions of the PSF-matched catalogs do not explicitly include rest-frame colors, which we calculate from the eazy-py files using the fsps templates.
The light distributions of all candidate sources exceed the aperture size of JWST’s MSAs. Any potential color gradients can lead to an intrinsic mismatch between the color information obtained from spectroscopy and the standard circular aperture photometry. The spectra mostly target the galaxy cores, while the aperture photometry can include a larger fraction of the full source. To mitigate this potential systematic, we extract a second set of photometry inspired by T. Nanayakkara et al. (2025). This customized photometry approximates the rectangular aperture of the central MSA and is measured from the same PSF-matched 40 mas EGS/CEERS or UDS/PRIMER mosaics. This conservative choice is made because the spectroscopic optimal extraction mostly weights light gathered in the central microshutter. Therefore, we assume that this photometry will be sufficiently close to the region probed by the MSA spectroscopy.
The customized NIRCam photometry further anchors the color information of these systems during modeling when used jointly with the NIRSpec PRISM spectra, which already have outstanding flux calibration. However, the derived luminosity-dependent physical properties, such as stellar mass and star formation rate, would be underestimated because the slitlike aperture cannot capture the total light of these extended objects. Therefore, we take the NIRCam F444W photometry documented in the existing public catalogs (produced with the methodology detailed in J. R. Weaver et al. 2024a) and apply corrections to any spectrophotometric modeling results that depend on the normalization of the SED. We defer the details of such corrections to Section 3.2. For a given source, the public catalogs provide a series of photometry measurements extracted from apertures of various sizes. The catalog also provides a “best-use” value extracted from the recommended aperture size, which varies from source to source depending on the morphology. We default to the photometry from the recommended aperture (i.e., values reported in the SUPER catalog) for the total F444W photometry with which we derive the scaling factor for our models. For sources in this sample, these apertures are typically 0 70 or 1
 00 in diameter.
3. Method
3.1. Principal Component Analysis Selection
Although two sets of rest-frame colors (e.g., U – V and V – J) have been used to identify Balmer or 4000 Å breaks in quiescent galaxies, the full SEDs probed by the 0.6–5.3 μm NIRSpec PRISM contain significantly more information. Historically, PCA has been applied to both spectroscopic and photometric data to classify the SEDs of extragalactic sources (e.g., V. Wild et al. 2014). The PCA primarily identifies the main characteristics shared among the dataset, which are known as the eigenspectra. For each galaxy, PCA returns a set of supercolors (SCs), whose total number equals the number of eigenspectra. These SCs are the normalizing coefficients of eigenspectra in the reconstruction of the original spectrum:

where Fλ,reconstructed(λ) is the reconstructed spectrum, Fλ,mean(λ) is the mean spectrum, Fλ,eigen,i(λ) are the eigenspectra, and n is the total number of SCs or eigenspectra. As n increases, the reconstructed spectrum converges to the original spectrum. Once a number n is chosen such that the residual between the reconstructed spectrum and the original spectrum is negligible, each set of n SCs can be taken as the low-dimensional representation of each spectrum.
Compared with traditional color selection, PCA enables visualization and classification of observed SEDs without relying on successful fits of spectral synthesis models. At z > 3, early JWST surveys have uncovered novel extragalactic sources that are difficult to constrain by traditional spectral synthesis models, such as “Little Red Dots” (LRDs; e.g., J. E. Greene et al. 2024; J. Matthee et al. 2024). In addition, the classical color selection of quiescent galaxies at this epoch is shown to be incomplete and impure (e.g., S. Belli et al. 2019; J. Antwi-Danso et al. 2023; M. Park et al. 2024; W. M. Baker et al. 2025a). Despite efforts to modify these color criteria, their selection effects are yet poorly understood. PCA provides a data-driven and model-independent approach for selecting and studying the properties of these sources. In this section, we explore the classification of RUBIES SEDs at 2 < z < 5 with PCA. Using PCA classification, we then focus on investigating the preselection of quiescent galaxies that enable the cost-efficient identification of this population.
Although we limit our identification of quiescent galaxies to the RUBIES dataset, for which the targeting strategy is well known, we define the eigenspectra and SC space by leveraging the full set of public NIRSpec/PRISM spectra from the DJA as follows. For RUBIES spectra, we include all spectra that correspond to sources with mF444W < 24. This ensures a complete selection below this magnitude limit in RUBIES. We further include any PRISM spectra logged with a signal-to-noise ratio (SNR) ≥ 5 on DJA from other JWST spectroscopic programs (including but not limited to JADES, F. D’Eugenio et al. 2025; CEERS, S. L. Finkelstein et al. 2023; UNCOVER, S. H. Price et al. 2025; GTO WIDE, M. V. Maseda et al. 2024).27 All selected spectra have reduction version 3 on DJA and robust spectroscopic redshifts. At low resolution (R ∼ 100 for the NIRSpec PRISM), the selection of quiescent galaxies relies heavily on the information from the Balmer or 4000 Å break as well as the UV slope. Given the wavelength coverage of the NIRSpec/PRISM (0.6–5.3 μm), we adopt a lower redshift cut of z ≥ 2.
We de-redshift and resample these spectra onto a universal rest-frame wavelength grid, using a package implemented in Python, SpectRes (A. C. Carnall 2017). We exclude spectra with significant data discontinuities between 2500 Å < λrest-frame < 7400 Å due to reduction quality issues, resulting in a final number of 3206 PRISM spectra. To minimize the contamination of strong emission line flux in our continuum-based selection, we mask out rest-frame 4775–5125 Å ([O III] + Hβ) and 6375–6725 Å ([N II] + Hα + [S II]) in all spectra. We opt to not mask the [O II] λλ3726, 3729 doublet in these spectra. While in some nonquiescent cases there is prominent [O II] emission, the total [O II] equivalent widths are typically smaller than those of [O III] + Hβ or [N II] + Hα + [S II]. Furthermore, due to the coarse wavelength resolution of PRISM around rest-frame 3700 Å, masking this doublet would have reduced spectral sampling of the Balmer break, which is crucial to the selection of quiescent galaxies.
We apply the SparsePCA method implemented by the standard Python package Scikit-learn to our preprocessed spectra. To select the number of eigenspectra n that is the most suitable for our goal of representing and classifying SEDs, we attempt PCA on the same dataset with various n setups. To quantify the quality of the spectroscopic reconstruction, we then define the mean absolute fractional residual of each spectrum as 〈∣(Fλ,original(λ) − Fλ,reconstructed(λ))/Fλ,original(λ)∣〉, where the bracket means the average over all wavelength bins. We examine the distribution of the mean fractional residual as a function of n. At n = 4, 99.9% of the sources have a mean fractional residual less than 0.02, suggesting that the reconstructed spectra of these sources account for ∼98% of the flux in the original spectra. At n > 4, each reconstructed spectrum accounts for a higher fraction of flux in the original spectrum, although this improvement becomes marginally better as n grows. At the same time, a higher number of SCs complicates the interpretation of these sources. Therefore, we choose n = 4 for our subsequent analysis.
The choice of SparsePCA is intended to identify eigencomponents corresponding to orthogonal features of the spectral continuum. In total, we identify four eigenspectra that correspond to the UV continuum slope, Balmer or 4000 Å break strength, red optical continuum slope, and IR continuum slope (see Figure 1 for details). This choice allows us to intuitively connect the distribution of the galaxy population in SC space to their physical properties. Thus, we can draw empirical cuts in the SC space to separate galaxies of different spectral types.
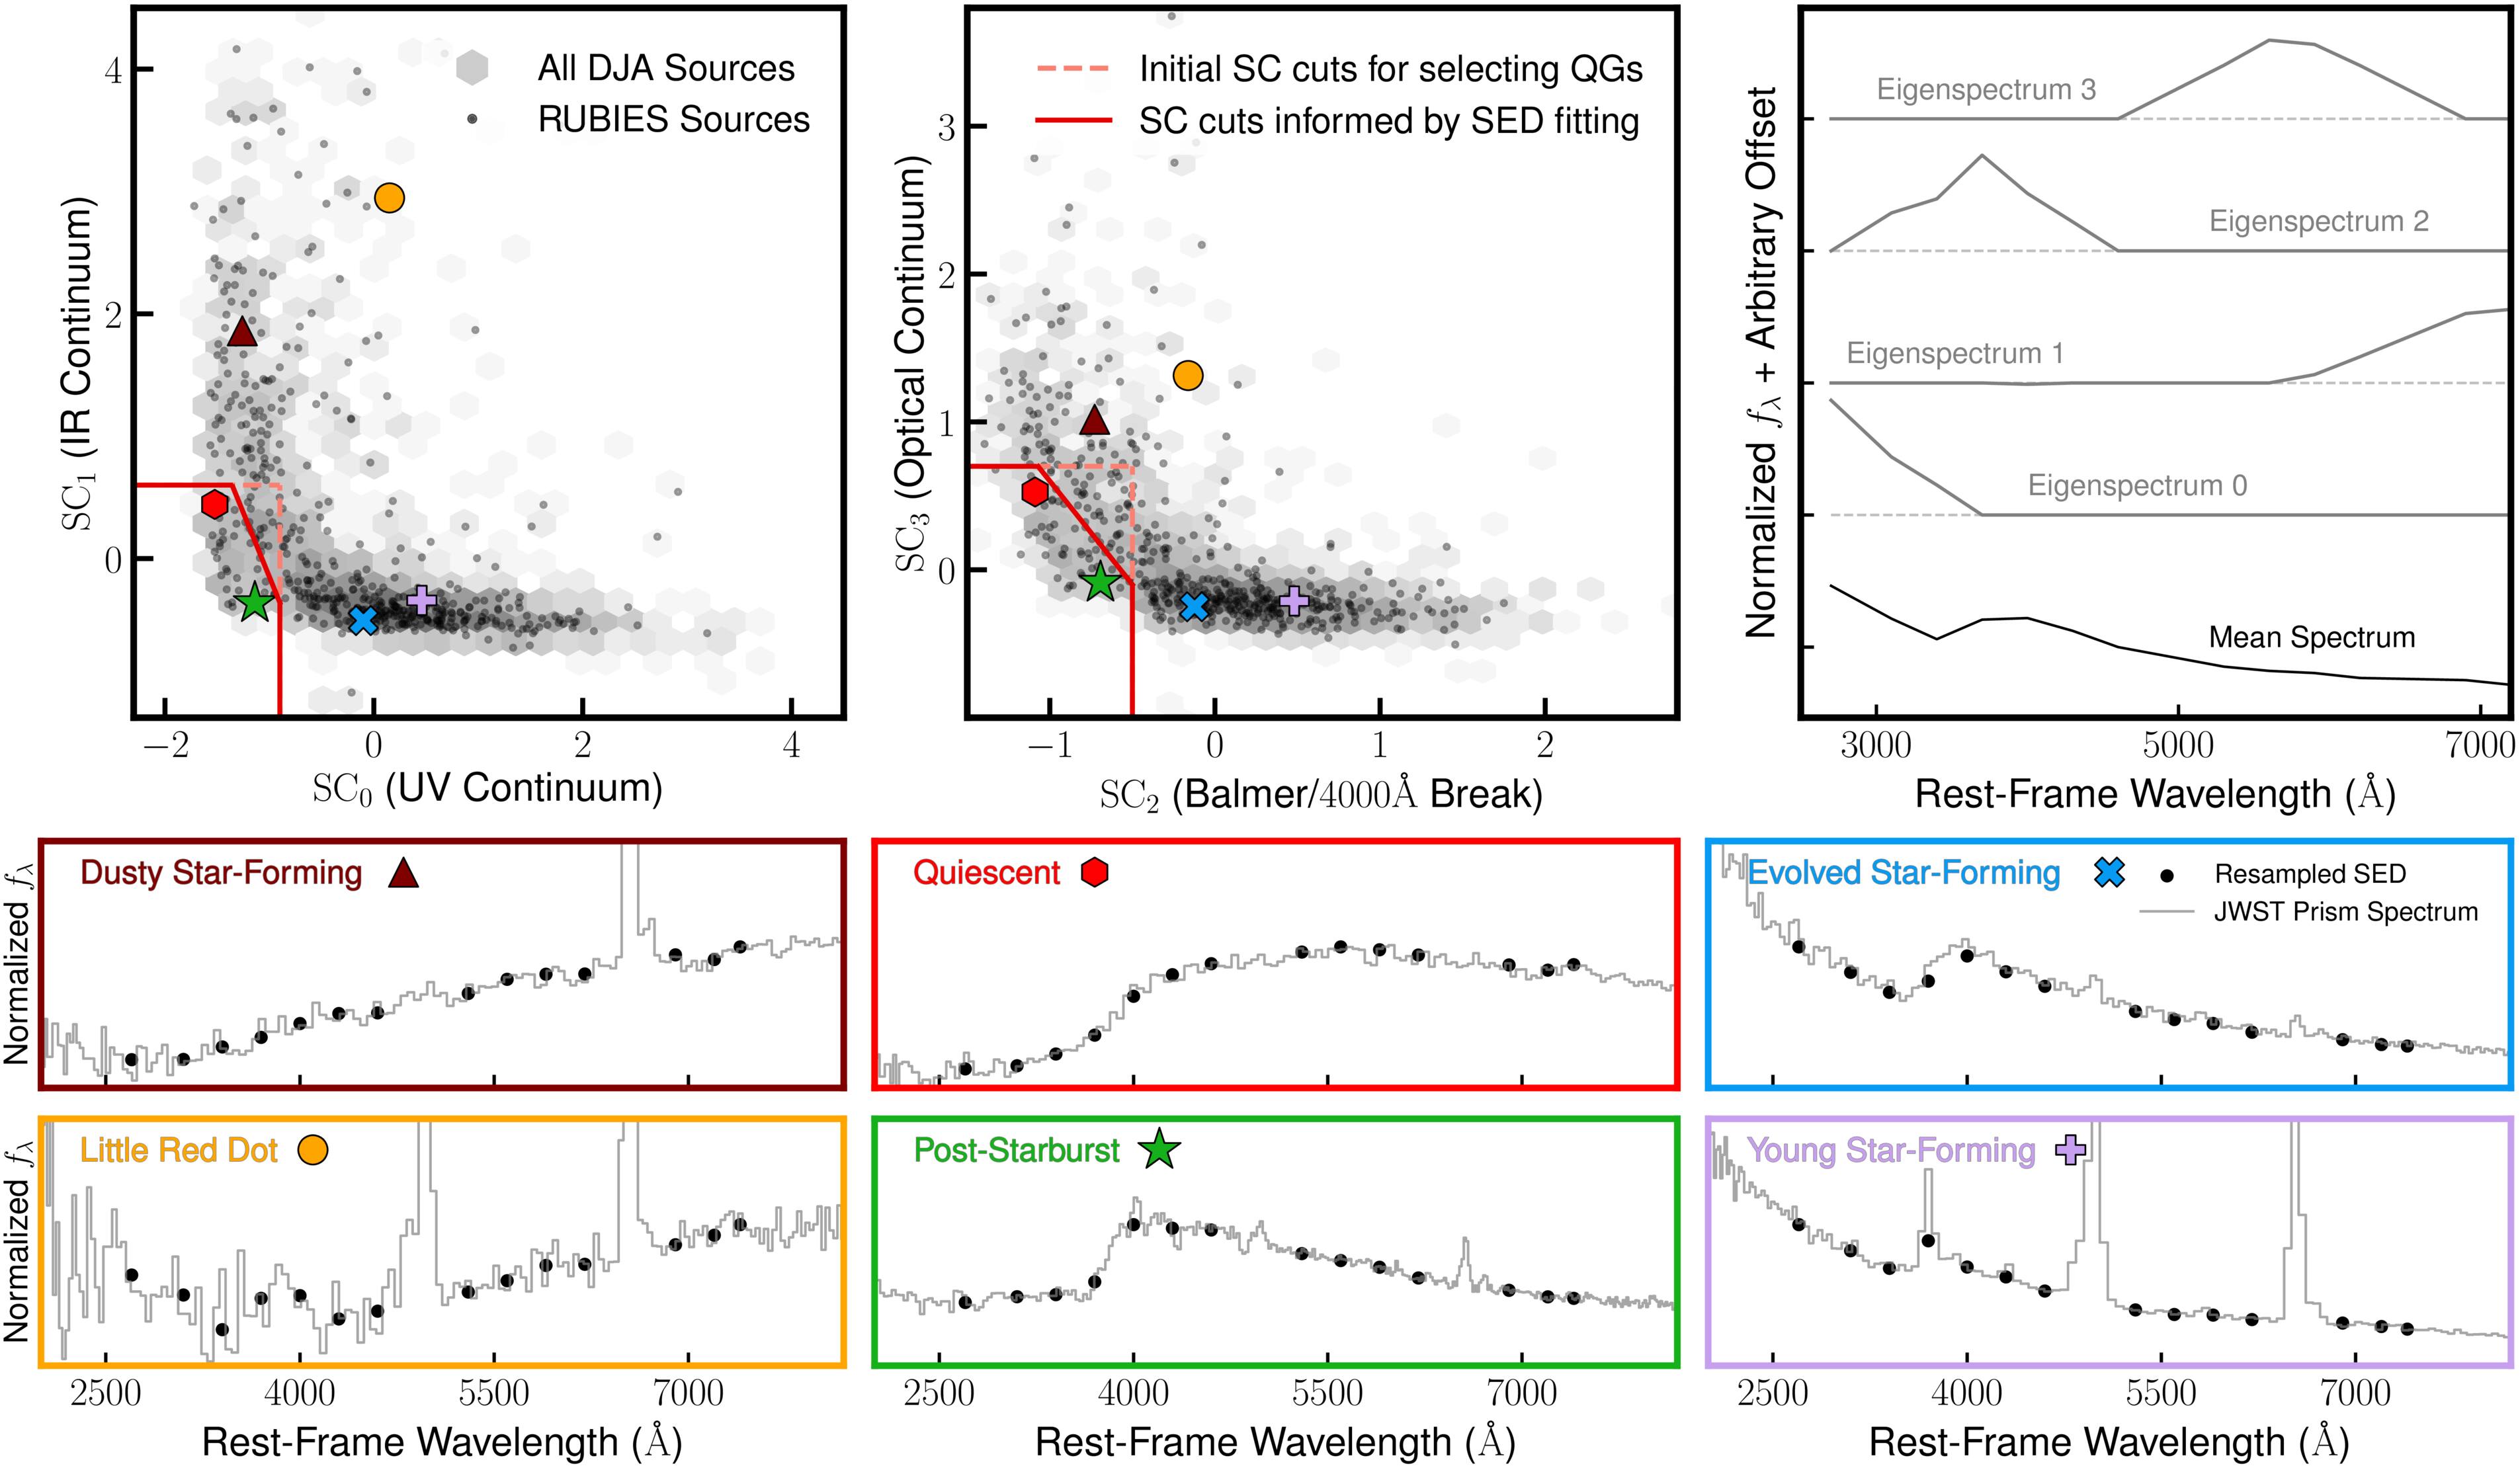
Figure 1. Demonstration of the PCA of NIRSpec/PRISM spectra from the DJA. The top row includes SC distributions (left and center) and derived eigenspectra (right panel). Each SC corresponds to the normalization of an eigenspectrum for each individual source, thus SC space location maps to spectral types. The bottom rows highlight representative examples: dusty star-forming galaxies (brown triangle), LRDs (yellow circle), old quiescent galaxies (red hexagon), young quiescent/poststarburst galaxies (green star), evolved/napping star-forming galaxies (blue cross), and young star-forming galaxies (purple cross). The de-redshifted original spectra are shown in gray. The SpectRes-resampled spectra used in the PCA are shown as black dots.
Download figure:
Standard image High-resolution imageIn Figure 1, we showcase our ability to select objects of different spectral types based on their location in the SC space. The vast majority of the galaxies targeted by early public JWST/NIRSpec programs, and therefore in our PCA, are star-forming galaxies (blue and purple). These sources have positive SC0, indicating that they possess excessive rest-frame UV flux on top of the mean spectrum. A fraction of them have a notable Balmer or 4000 Å break (blue), as suggested by their slightly negative SC2. These galaxies have relatively evolved stellar populations and likely had stochastic SFHs (V. Strait et al. 2023; T. J. Looser et al. 2024; A. Covelo-Paz et al. 2025; G. Khullar et al. 2025, in preparation). The LRDs (yellow), whose physical nature is hotly debated, reside in an isolated regime in the SC space. Since they are typically characterized by their unique “V-shaped” continua that turn over at the Balmer limit (e.g., D. J. Setton et al. 2024a; R. E. Hviding et al. 2025), these sources tend to have both positive SC0 and SC1. However, the UV colors of faint LRDs are not uniform and consequently, LRDs can shift toward lower SC0 (C. C. Williams et al. 2024). The quiescent galaxies (green and red) have the strongest Balmer or 4000 Å break strengths and almost no rest-frame UV emission, residing in the lower-left corner of both SC0–SC1 and SC2–SC3 SC space. The spectral signature of older quiescent galaxies (red) is dominated by stars with longer lifetimes than A-type stars, as they have typically quenched over ∼0.8 Gyr. In contrast, the spectral signature of young quiescent galaxies (or recently quenched and/or poststarburst galaxies; green) is dominated by A-type stars, since they typically quenched within ∼0.8 Gyr. Older quiescent galaxies tend to have flatter optical–NIR continuum slopes and therefore have slightly higher SC3 and SC1 than the young quiescent galaxies. They are also characterized by a 4000 Å break instead of the Balmer break characteristic of younger quiescent galaxies, which is reflected by their lower SC2. However, the exact boundary between dusty star-forming galaxies (maroon) and old quiescent galaxies (red) is difficult to determine in the SC space. As the PCA is essentially an operation that lowers the dimension of the dataset, the subtle difference in the spectral shape required to break the dust–age degeneracy becomes hard to map to the SC location.
Using the visualization of spectral types in Figure 1, we can immediately eliminate sources that are unlikely to be quiescent galaxies without having to perform computationally expensive stellar population synthesis modeling on the entire RUBIES dataset. In order to ensure a complete selection of quiescent galaxies in RUBIES, we adopt generous initial SC cuts, outlined by light-red dashed lines in Figure 1. These cuts effectively remove any sources with spectral features that are mutually exclusive with quiescence. The cut in SC0 removes sources with significant UV flux, which still host massive stars and therefore recent star formation. The cut in SC2 removes sources without a prominent Balmer or 4000 Å break, which lack evolved stellar populations. The cuts in SC1 or SC3 remove sources with a continuum slope at red optical or NIR wavelengths corresponding to significant dust reddening, which is rare in quiescent galaxies (D. J. Setton et al. 2024; J. C. Siegel et al. 2025).
Using this preselection, we identify an initial sample of 41 unique mF444W < 24 sources at 2 < z < 5 from RUBIES. Next, we perform spectrophotometric modeling, as follows, to completely disentangle the dusty star-forming and quiescent populations in the initial sample. In Appendix B, we refine these SC cuts to boost selection purity using the best-fitting SED models. The refined SC cuts are shown as red solid lines in Figure 1.
3.2. Spectrophotometric Fitting
In order to infer the physical properties of PCA-selected galaxies and finalize our selection of quiescent galaxies, we simultaneously fit the PRISM spectrum and NIRCam photometry, using the Bayesian stellar population inference code Prospector (B. Johnson & J. Leja 2017; J. Leja et al. 2017; B. Johnson et al. 2021) with the nested sampling code dynesty (J. S. Speagle 2020). Prospector uses the stellar population synthesis models from the Flexible Stellar Population Synthesis package (C. Conroy et al. 2009; C. Conroy & J. E. Gunn 2010). We adopt the MILES spectral library (P. Sánchez-Blázquez et al. 2006; J. Falcón-Barroso et al. 2011) and MIST isochrones (J. Choi et al. 2016; A. Dotter 2016), assuming a Chabrier IMF (G. Chabrier 2003). Using the ProspectorPolySpecFit instance, we opt to use a polynomial of order 5 to flux calibrate the spectrum to photometry, which we extract from customized apertures described in Section 2.2. We enforce a minimum uncertainty floor of 5% on both the spectrum and photometry.
The setup strategy in our fits is similar to those in A. de Graaff et al. (2025b). We choose a nonparametric SFH that utilizes the continuity prior of Prospector described in J. Leja et al. (2019a). Given the wide range of redshifts in our sample, we adopt different age bins for each object. For the most recent 200 Myr in lookback time, we divide it into four bins of 10, 40, 50, and 100 Myr, then we linearly add four bins of 200 Myr until we reach 1 Gyr in lookback time. The remaining time is evenly divided into Nold bins. We calculate Nold by taking the ceiling of (tUniverse − 1 Gyr)/0.5 Gyr, where tUniverse is the age of the Universe. The number of old bins ranges from one to five for our sample at 2 < z < 5. We fix the redshift to msaexp-derived spectroscopic redshifts. We assume a two-parameter (M. Kriek & C. Conroy 2013) dust law, which is parameterized by the attenuation around old (t > 10 Myr) stars fit in the range τ ∈ [0, 2.5] and a free dust index δ ∈ [−1, 0.4] that describes the deviation from the D. Calzetti et al. (2000) dust law and includes a UV bump that depends on the slope parameterized as in S. Noll et al. (2009). We fix the attenuation around young (t < 10 Myr) stars to be twice that of the older populations. The stellar metallicity is set as a free parameter with a logarithmically sampled uniform prior in the range ![${\mathrm{log}}(Z/{Z}_{\odot })\in \,[-2,0.2]$](https://content.cld.iop.org/journals/0004-637X/997/2/252/revision1/apjae24e1ieqn6.gif) . We mask all wavelengths shorter than rest-frame 1200 Å to avoid contributions from intergalactic medium absorption. We marginalize over the emission lines (specifically, [Ne V] λ3426, [O II] λλ3726, 3729, [O III] λλ4959, 5007, [N II] λλ6548, 6584, [S II] λλ6716, 6731, [S III] λλ9069, 9532, Hα, Hβ, Hγ, and Hδ) by fitting Gaussian profiles. In these Gaussian profiles, the normalization is set as a free parameter, the center is fixed to the line center, and the width is tied to the galaxy intrinsic dispersion and convolved with the instrumental resolution.
. We mask all wavelengths shorter than rest-frame 1200 Å to avoid contributions from intergalactic medium absorption. We marginalize over the emission lines (specifically, [Ne V] λ3426, [O II] λλ3726, 3729, [O III] λλ4959, 5007, [N II] λλ6548, 6584, [S II] λλ6716, 6731, [S III] λλ9069, 9532, Hα, Hβ, Hγ, and Hδ) by fitting Gaussian profiles. In these Gaussian profiles, the normalization is set as a free parameter, the center is fixed to the line center, and the width is tied to the galaxy intrinsic dispersion and convolved with the instrumental resolution.
The line-spread function curves in the original JWST User Documentation (JDox) are broader than those measured in practice, depending on the exact source morphology (A. de Graaff et al. 2024). Before fitting, all models are convolved with a line-spread function that is a factor of 1.3 narrower than the JDox curves to account for instrumental dispersion, following A. de Graaff et al. (2025b). We additionally include two free velocity dispersions that smooth the stellar continuum and ionized gas emission, which we allow to vary in the range [0, 1000] km s−1 to marginalize over the uncertainty in the line-spread function in addition to the intrinsic dispersion of the galaxy.
As described in Section 2.2, physical properties inferred from SED fitting, such as stellar mass, have to be corrected because the customized photometry does not capture the total light from each galaxy due to the small aperture sizes. We derive an aperture-to-total flux correction from the ratio of F444W flux within the rectangular MSA apertures to the PSF-matched total in the same band. We apply this correction factor to the derived stellar mass and SFH for each galaxy. Once multiplied with the fifth-order polynomial and the scaling factor to F444W total aperture flux, the spectrum in these fits typically increases by a factor of ∼1–2, which is a modest correction since the default slit-loss correction in the DJA pipeline cannot be perfect. Following typical conventions, all masses are reported as surviving stellar mass. We note that this modeling assumes solar-scaled stellar population models. Given that these massive galaxies are probably α-enhanced (e.g., A. G. Beverage et al. 2025), this will slightly overestimate the masses and ages (M. Park et al. 2024).
In Figure 2, we show two examples of our spectrophotometric fits: a young quiescent (poststarburst) galaxy at z ∼ 4 (top) and an old quiescent galaxy at z ∼ 2.7 (bottom). In the upper left panels, the observed spectrum and its uncertainties are shown in red, and the observed photometry with error is shown in orange. The best-fitting model spectrum and photometry are shown in black. Both the observed and model spectra have been scaled by the polynomial calibration vector to match the photometry. The insets show the NIRCam/F444W cutout (2 4 in width) of the target galaxy. The red rectangle traces the central MSA (for slitlike aperture photometry), and the red circle traces the circular aperture from which the catalog photometry was extracted. The bottom left panels show the residuals for the spectrum and photometry of the fits (χ values), which we define as the difference between observed flux and best-fitting model flux, normalized by the uncertainties in the observed flux. The right panels show the median and 68% confidence interval SFHs for these galaxies as solid black curves and gray regions, respectively. We show the median and 68% confidence interval of t90 (lookback time at which 90% of the current stellar mass was formed) in the same panels as dashed red lines and light-red regions, respectively. Overall, these fits are excellent and enable the characterization of SFHs and the physical properties of these galaxies. The SED fits and SFHs of the remaining galaxies in this sample are shown in Appendix A.
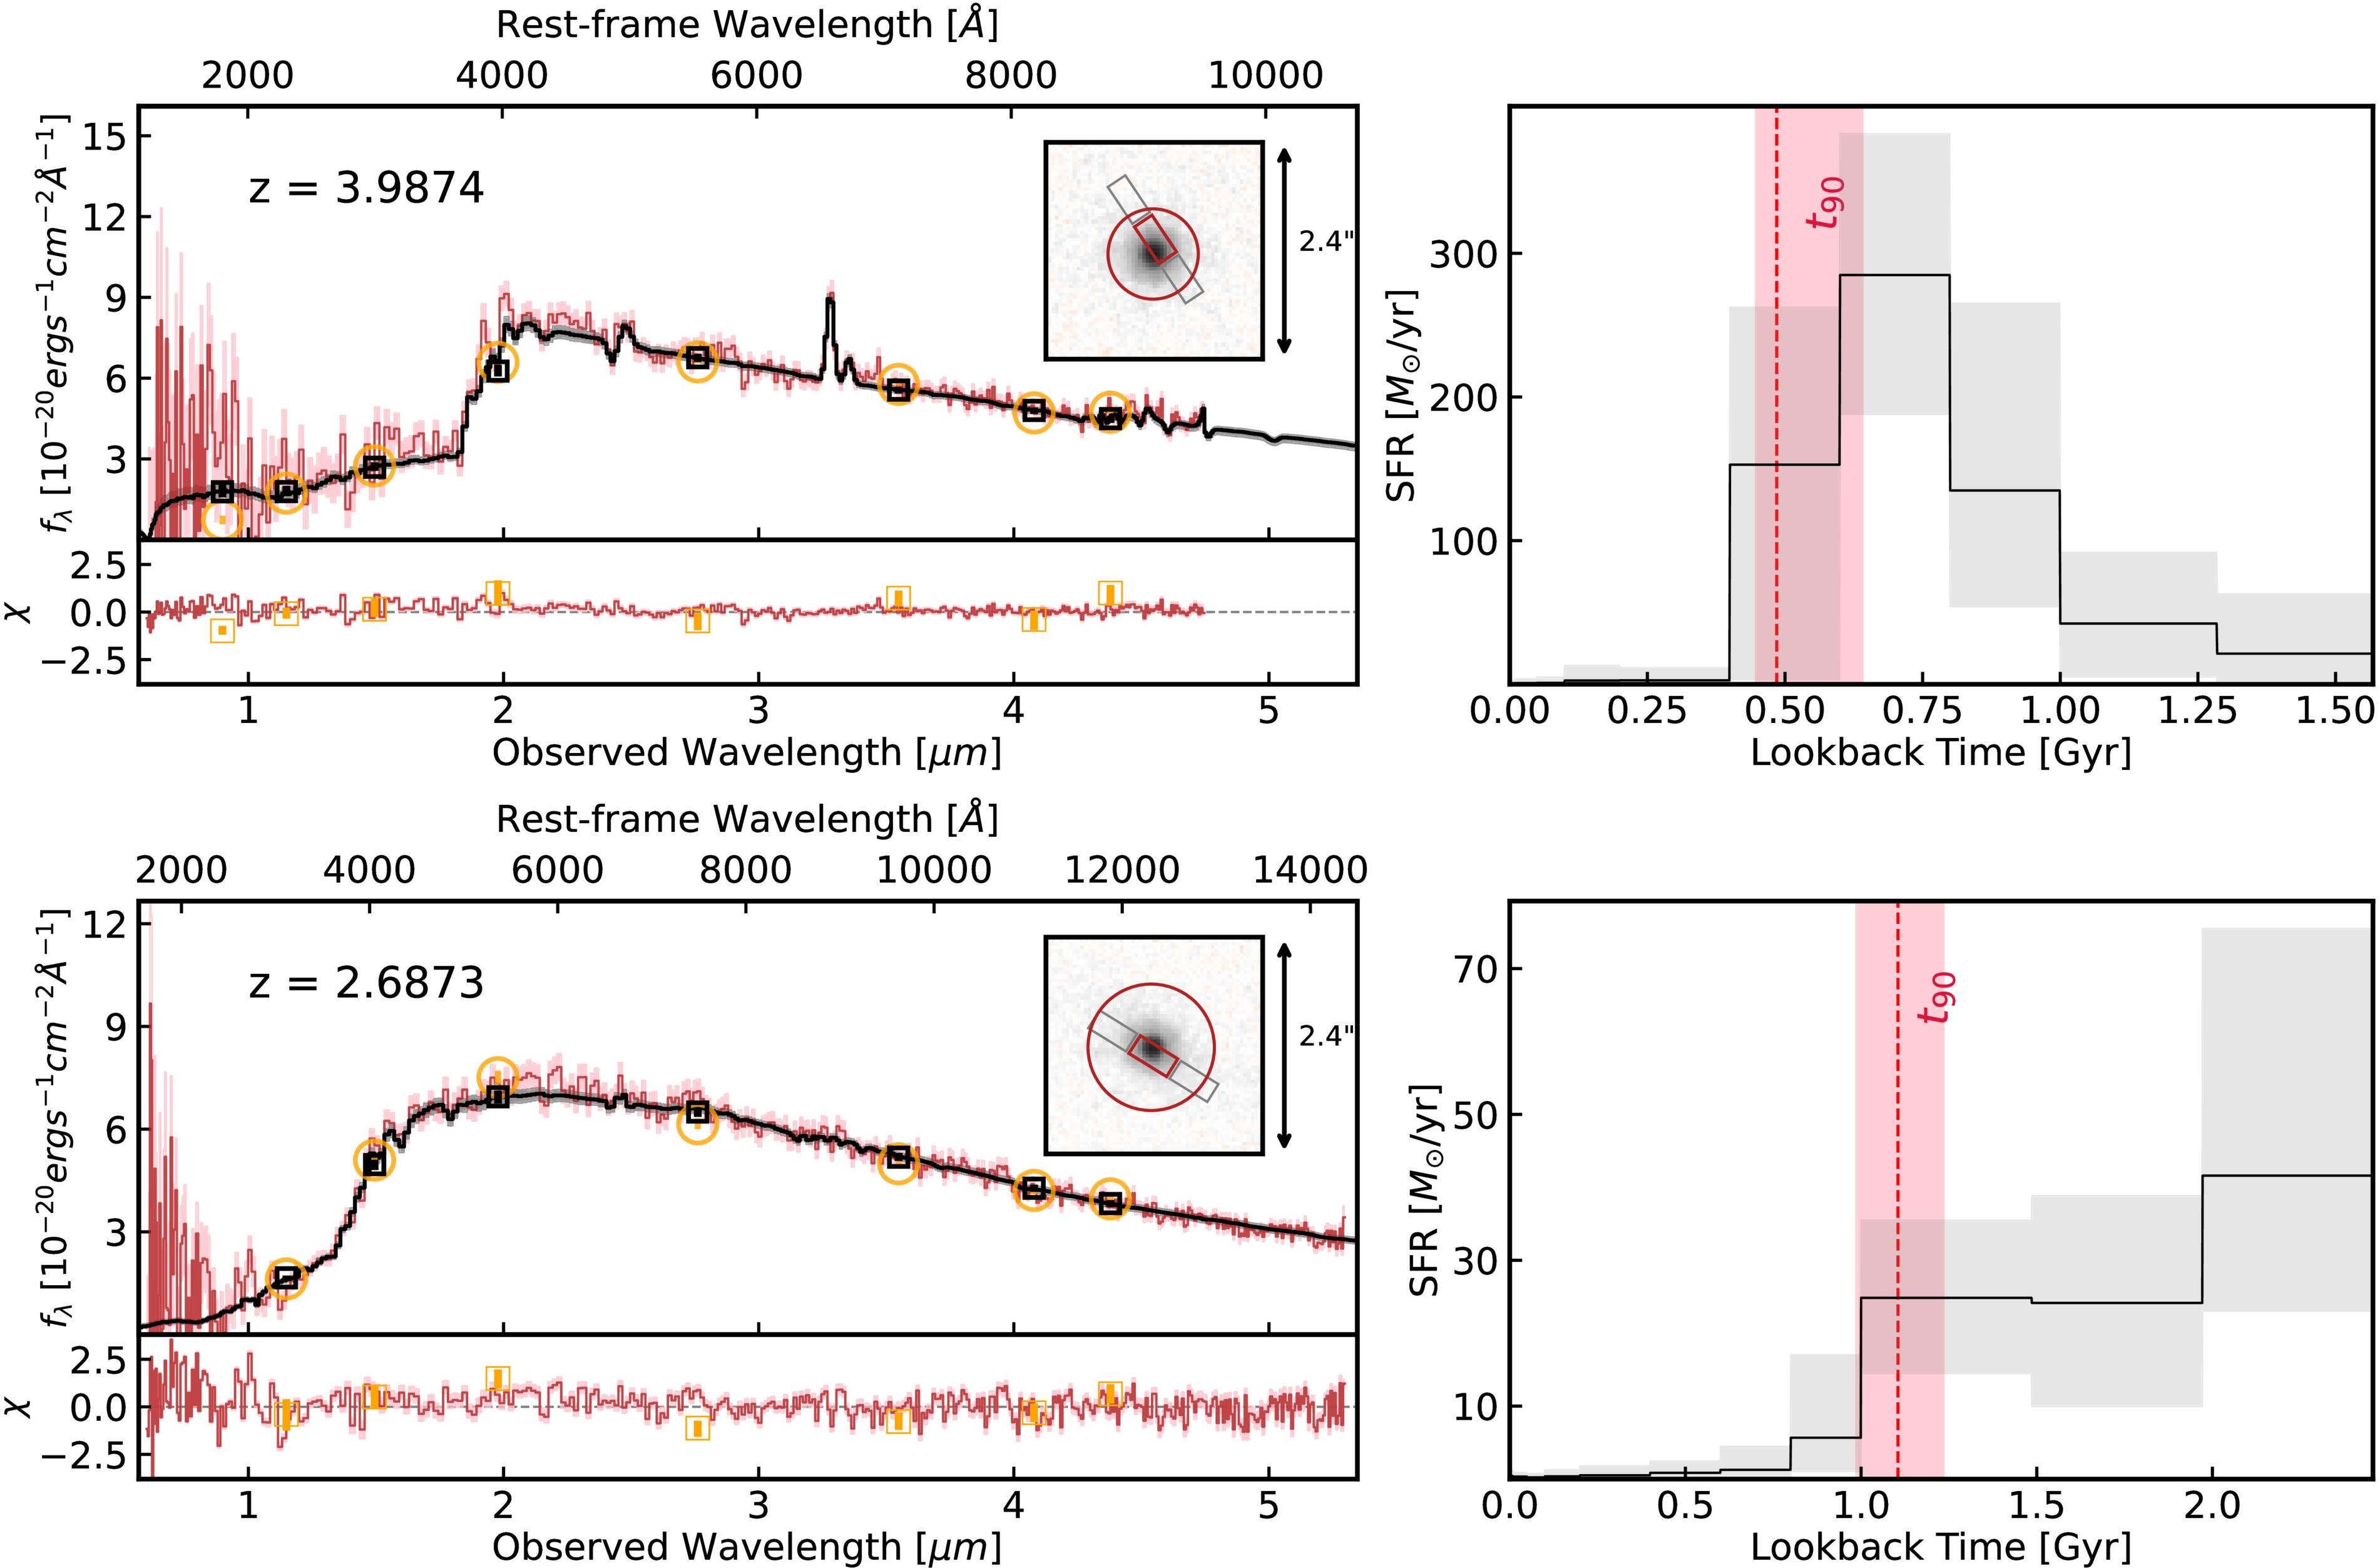
Figure 2. Example spectrophotometric fits of a z ∼ 4 poststarburst galaxy (ID: RUBIES-UDS-12594) and an old quiescent galaxy (ID: RUBIES-EGS-42328). For each row, the upper left panel shows the SED of observed NIRCam photometry and the uncertainties (orange circles and error bars), observed NIRSpec PRISM spectrum and uncertainties (red solid lines and pink bands), best-fit model photometry and its 68% confidence interval (black squares and error bars), and best-fit model spectrum and its 68% confidence interval (black solid lines and gray bands). The bottom left panel shows the residuals of our fits to the observed photometry (orange squares) and spectrum (red solid line). The inset shows the NIRCam/F444W image of the target galaxy. The red rectangle traces the central MSA used to compute slitlike aperture photometry, and the red circle traces the circular photometric catalog aperture. The right panels show the median (lines) and 16%–84% intervals (bands) for the inferred SFHs and t90 measurements. These fits allow us to robustly determine the physical properties of these galaxies.
Download figure:
Standard image High-resolution image4. The Selection of Quiescent Galaxies
4.1. The Selection and Classification of the RUBIES Quiescent Galaxy Sample
Based on our initial PCA selection, we find that that the majority (∼90%) of the bright (F444W < 24 ∪ SNR > 5) RUBIES sources at 2 < z < 5 possess empirical spectral features that unambiguously eliminate their possibility of being quiescent systems (see Section 3.1 for a qualitative discussion). Our approach to identifying quiescent galaxies is iterative. First, we apply the initial conservative SC cuts (light-red dashed lines in Figure 1) to focus on potentially quiescent sources and minimize the computational cost. We model the preselected galaxies with Prospector and infer their physical properties. We examine the relation between the SCs and specific SFR (sSFR) among these galaxies and identify a smaller region in SC space that robustly identifies quiescent galaxy SEDs (red solid lines in Figure 1). This selection largely avoids contamination from other red sources, including dusty star-forming galaxies and those with decreased, but significant, ongoing star formation.28 Next, we describe the identification and classification of quiescent galaxies, using the physical properties and SFHs of galaxies selected by the refined SC cuts.
In the left panel of Figure 3, we show the best-fitting stellar mass versus sSFR from Prospector for all galaxies in the refined SC-selected sample. To test whether binary classification is sensitive to measurement uncertainties, we define two quiescent criteria as follows:
- 1.Criterion 1 (red symbols). sSFR50th < 10−10 yr−1 and
- 2.Criterion 2 (pink symbols). sSFR16th < 10−10 yr−1.
We adopt Criterion 1 as our primary criterion of quiescence, which yields 17 quiescent galaxies in total as our fiducial sample. Criterion 2 includes three more galaxies that could have been selected by Criterion 1 if their sSFRs are perturbed by 1σ. In the following discussion, we also refer to these three galaxies as “marginally quiescent.” We verify that an evolving sSFR threshold (e.g., sSFR50th < 0.2/tUniverse(z) Gyr−1 as in A. C. Carnall et al. 2023a; W. M. Baker et al. 2025a) identifies almost the same quiescent galaxies as our fiducial sample, including one additional galaxy at 4 < z < 5 (ID: RUBIES-UDS-140707).
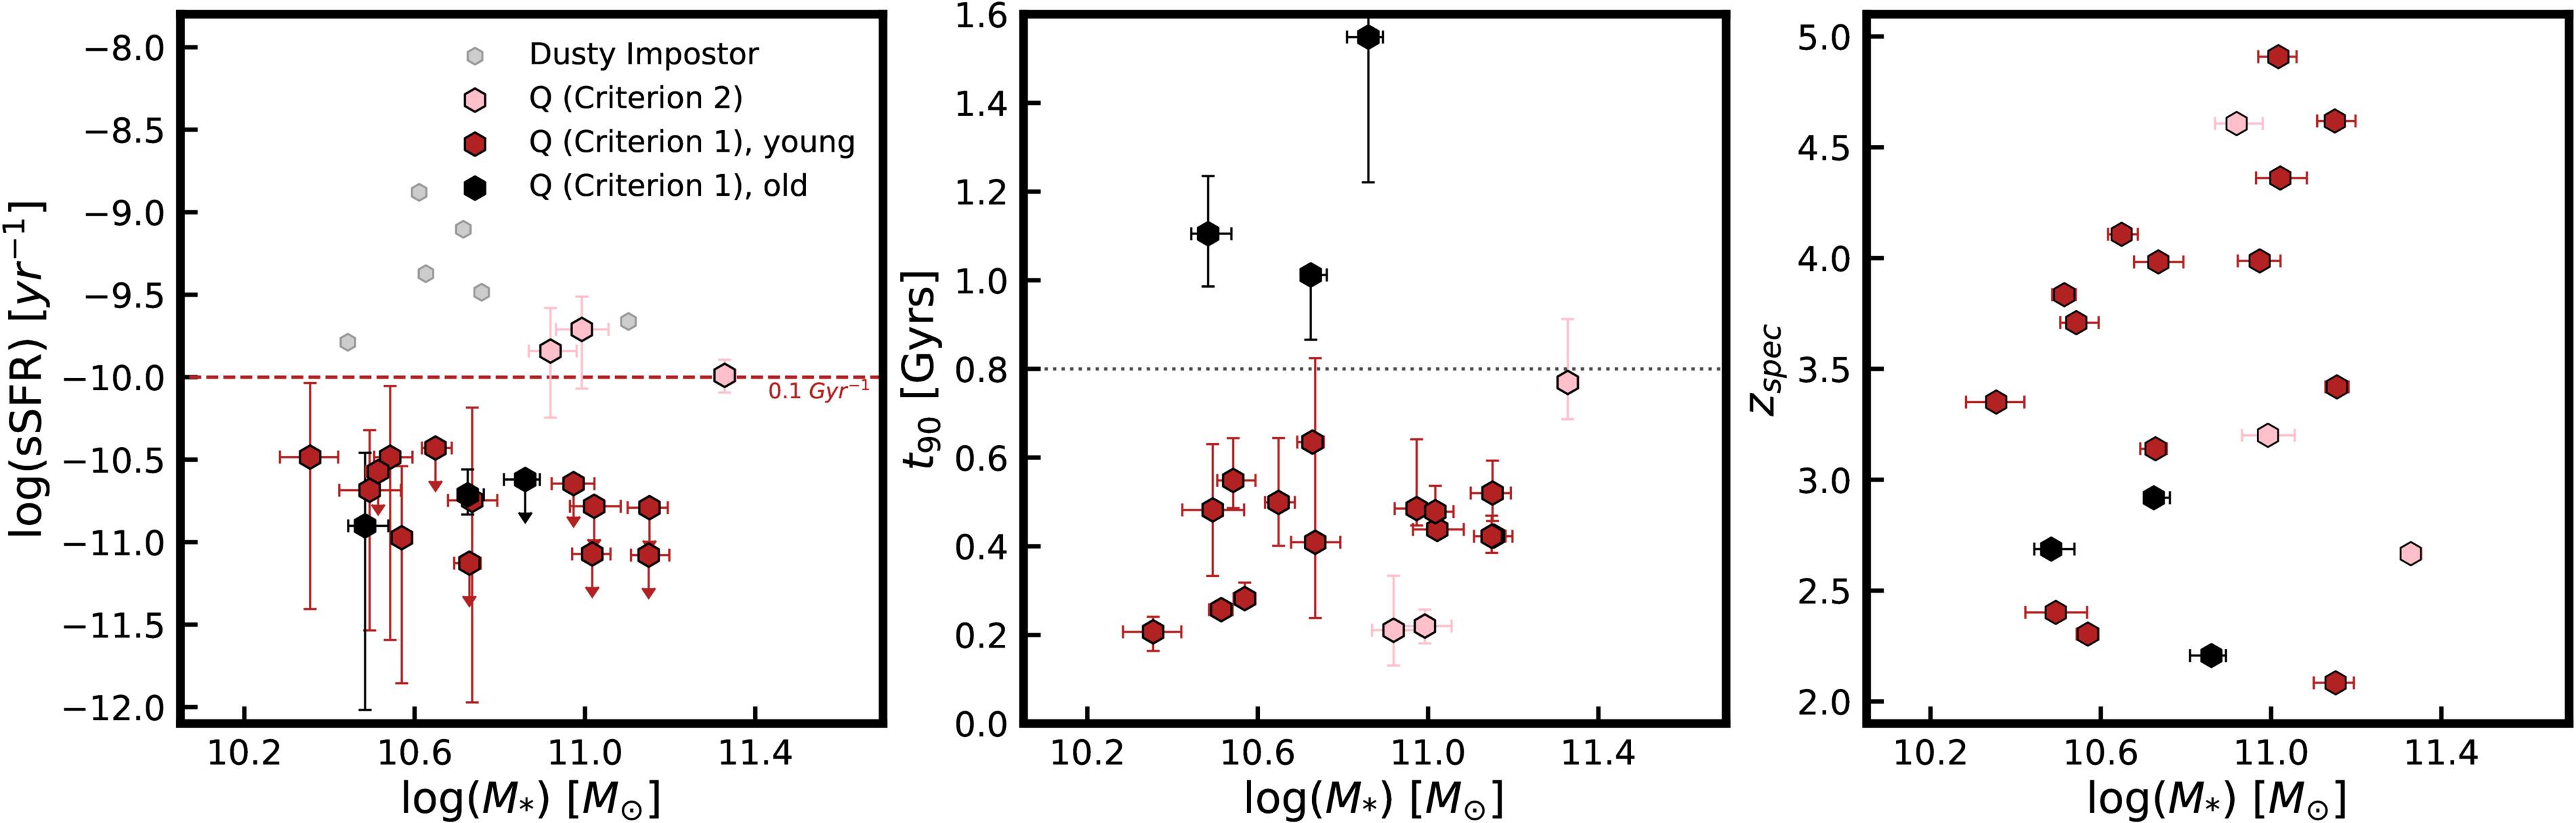
Figure 3. Left panel: stellar mass versus sSFR for SC-selected quiescent galaxy candidates. Robust quiescent galaxies (Criterion 1) are shown in red, and marginally quiescent cases (Criterion 2) are shown in pink. Galaxies with the 50th percentile sSFR < 10−10 yr−1 are shown as upper limits. One galaxy (ID: RUBIES-EGS-61168) is not in the range of this plot due to its extremely low sSFR. Middle panel: stellar mass versus t90 for all galaxies. We additionally divide our sample into young quiescent galaxies (t90 < 0.8 Gyr, red or pink) and old quiescent galaxies (t90 > 0.8 Gyr, black). Right panel: stellar mass versus spectroscopic redshift of the finalized sample galaxies. The old quiescent population emerges at z ∼ 3.
Download figure:
Standard image High-resolution imageUsing the SFHs inferred by Prospector, we calculate the formation timescale (t90 or the lookback time by which a galaxy formed 90% of its current stellar mass) of each quiescent galaxy. In the following analysis, we use t90 as a proxy for time since quenching to differentiate between the old and young galaxy populations. In the middle panel of Figure 3, we show t90 versus stellar mass for all quiescent galaxies. Most of the quiescent galaxies in our sample are young (pink or red) with best-fit t90 < 0.8 Gyr. In the right panel of Figure 3, we show the distribution in stellar mass versus redshift. All older (t90 > 0.8 Gyr) sources (black symbols) are found at the lowest redshifts (2 < z < 3). The SEDs of these galaxies prominently display 4000 Å breaks rather than Balmer breaks (see Figures 2 and 8). The earliest emergence of the older quiescent population at z ∼ 3 in this sample is roughly contemporaneous with the record holder of the “maximally old” quiescent galaxy at z = 3.2 reported in K. Glazebrook et al. (2024). At face value, they are likely the descendants of the first generation of massive quiescent galaxies at z ≥ 5–7 (A. de Graaff et al. 2025b; A. Weibel et al. 2025). However, we note that the stellar masses of these examples are slightly lower than the current higher-redshift counterparts in A. Weibel et al. (2025) and A. de Graaff et al. (2025b). This discrepancy could simply reflect cosmic variance or a systematic bias in mass inference between galaxies in different evolution stages. The inferred physical properties relevant to the selection and classification of the complete quiescent sample are tabulated in Table 2.
This final sample includes the most massive quiescent galaxies (median M* ∼ 1010.7 M⊙) at 2 < z < 5 in RUBIES, in part because we enforce the parent sample to include only the bright galaxies with mF444W < 24. However, this magnitude limit does not translate to a uniform mass limit for the entire final sample. Although these galaxies span a wide range of redshifts (2 < z < 5), galaxies are younger and therefore have higher mass-to-light ratios at higher redshift, somewhat mitigating the increasing luminosity distance.
To derive the redshift-dependent effective mass–completeness limit, we obtain rescaled analogs of the observed galaxies, using a grid of redshifts and stellar masses and best-fitting Prospector models. For a group of models within a range of redshift, we compute their F444W magnitude corresponding to a given stellar mass and examine where they would pass the F444W < 24 threshold. The details of this analysis are presented in Appendix B. It suggests that our magnitude-limited selection is complete above 1010.3 M⊙ at 2 < z < 3, above 1010.5 M⊙ at 3 < z < 4, and above 1010.6 M⊙ at 4 < z < 5.
We also investigate how dust attenuation (AV) could affect the locations of the true quiescent population in this sample in SC space. Using the best-fit Prospector models for all sSFR50th < 10−10 yr−1 galaxies, we re-generate model SEDs for a grid of AV values. The details of this analysis are presented in Appendix B. In brief, the true quiescent galaxies generally move along a diagonal track with a negative slope in SC0–SC1 and SC2–SC3 as their dust attenuation increases. In addition to the initial SC thresholds, the diagonal SC cuts in SC0–SC1 and SC2–SC3 (shown as red solid lines in Figure 1) are roughly parallel to the AV evolution track of the true quiescent population. We find that our refined SC cuts should be complete for quiescent galaxies with AV < 0.7.
4.2. How Would This Sample Have Been Selected with Rest-frame Colors?
While spectroscopy remains the most robust tool to identify quiescent galaxies, photometric samples will always provide a comprehensive and cost-efficient probe of the cosmic volume, although at the expense of purity (e.g., A. C. Carnall et al. 2023a; F. Valentino et al. 2023; S. Alberts et al. 2024; A. S. Long et al. 2024). We now estimate the purity and completeness of various rest-frame color selection criteria if applied to this spectroscopic sample of massive quiescent galaxies at 2 < z < 5.
In Figure 4, we show the rest-frame UVJ color distribution of all galaxies in EGS and UDS with F444W < 24 at 2 < z < 5 in the left panel and their rest-frame usgsis colors (J. Antwi-Danso et al. 2023) in the middle panel. The galaxies in RUBIES that are selected by our refined SC cuts are shown as hexagon symbols, whose color coding follows previous convention. Other galaxies in RUBIES that are excluded by the refined SC cuts are shown as black dots. All the remaining field galaxies not surveyed by RUBIES are binned into 2D histograms, where the darker color indicates the higher density of objects.
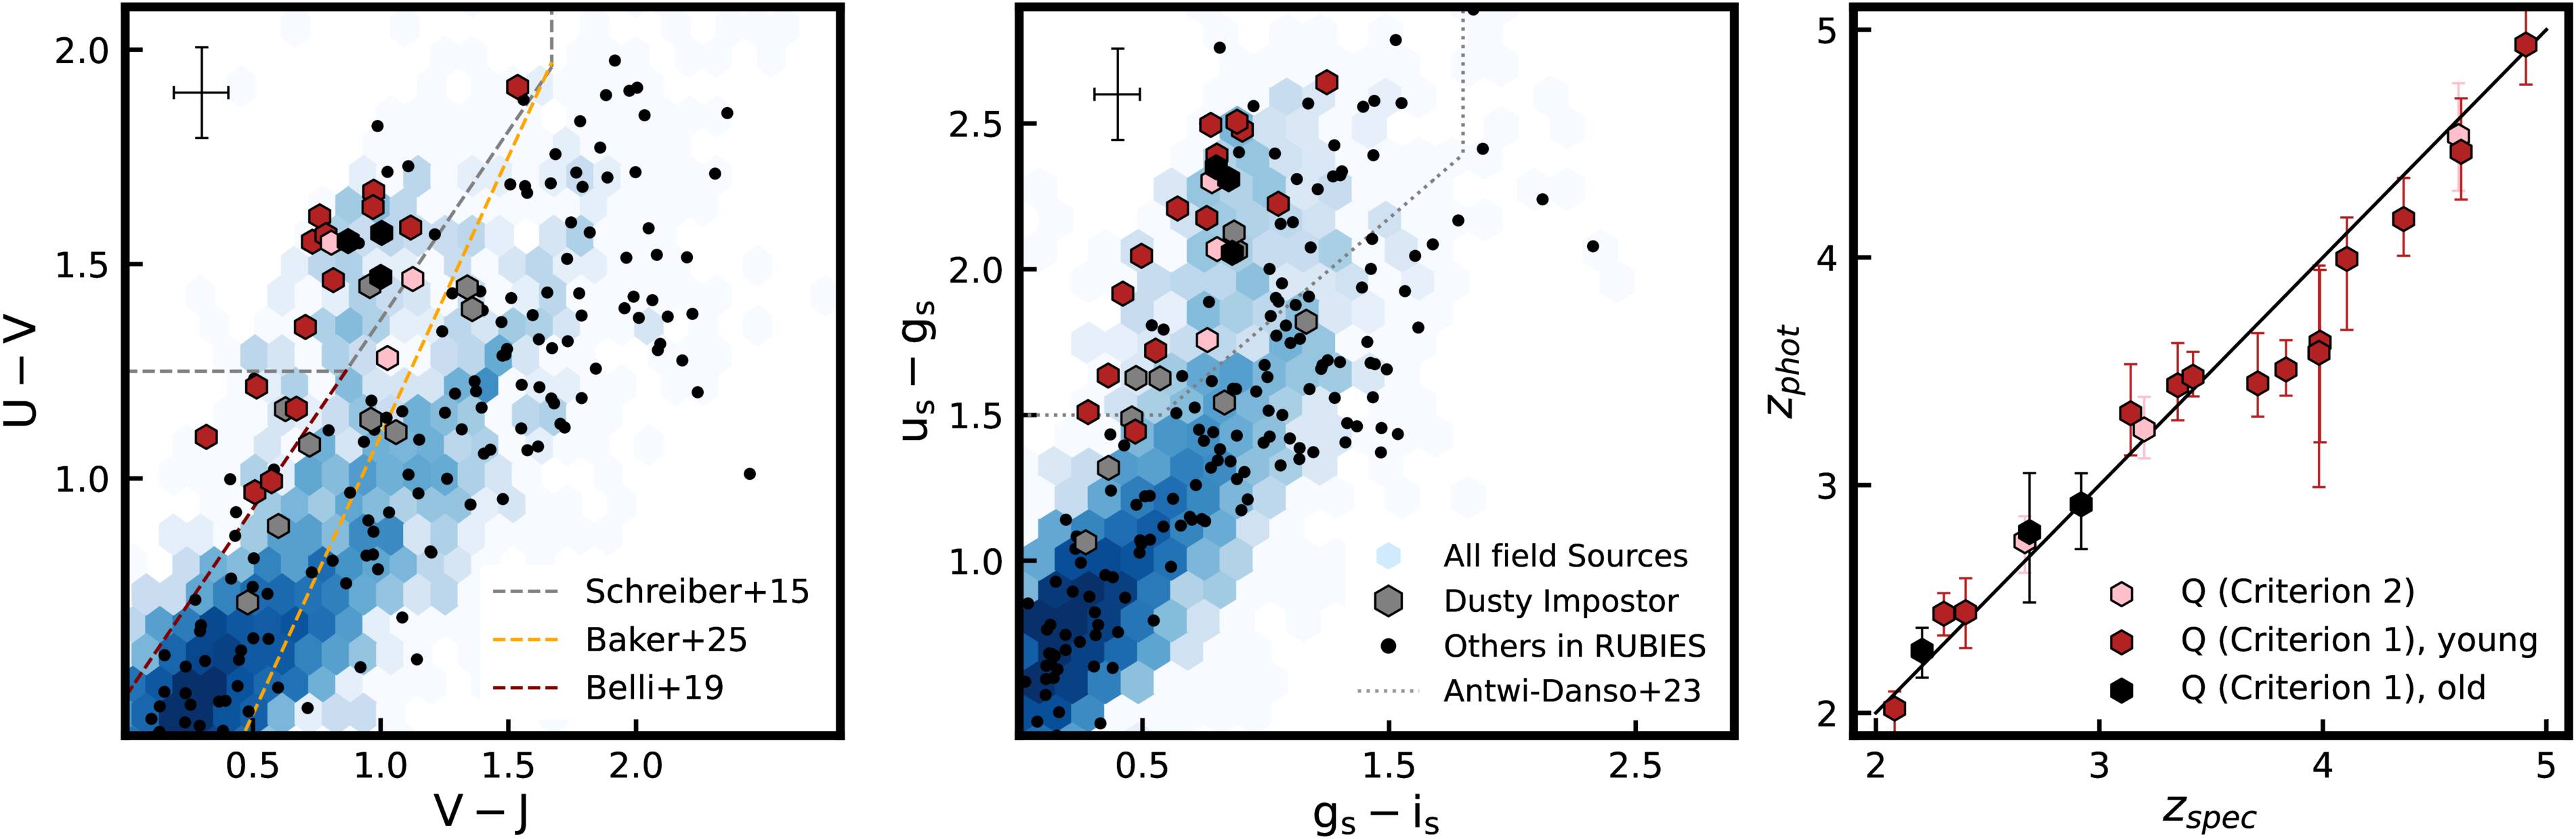
Figure 4. Left panel: rest-frame UVJ colors of all (F444W < 24) galaxies at 2 < z < 5 in EGS and UDS. We show the SC-selected RUBIES galaxies as hexagon symbols, whose color coding follows previous convention. We show the remaining galaxies in RUBIES as black dots. Finally, the distribution of any EGS or UDS galaxies not in RUBIES are shown by 2D histogram bins, in which the darker color indicates higher density. Middle panel: rest-frame usgsis colors of the same set of galaxies. The characteristic uncertainties in these rest-frame colors are shown by the error bars in the upper left corners. All rest-frame color selections shown here suffer from various degrees of impurity and incompleteness, which we discuss in detail in the text. Right panel: EAZY-derived photometric redshifts versus spectroscopic redshifts of all RUBIES massive quiescent galaxies. These photometric redshifts are largely consistent with the redshifts recovered from the PRISM spectroscopy, though they are the main contribution to uncertainties in rest-frame colors.
Download figure:
Standard image High-resolution imageThe conventional rest-frame UVJ selection criteria with a horizontal U – V cut (e.g., R. J. Williams et al. 2009; K. E. Whitaker et al. 2011; C. Schreiber et al. 2015) misses some of the youngest quiescent galaxies in our sample, as expected (e.g., W. M. Baker et al. 2025a). Extending to bluer U − V colors (diagonal dashed lines; S. Belli et al. 2019; W. M. Baker et al. 2025a) captures many excluded galaxies, for this quiescent sample (sSFR50th < 10−10 yr−1) ∼30% have U − V < 1.23. We find contamination fractions of ∼35% in both the classical and extended UVJ criteria, which is high but largely consistent with the ∼10%–30% reported in J. Leja et al. (2019b), J. Antwi-Danso et al. (2023), and T. Nanayakkara et al. (2025). We return to discuss the impact of false positivity on number densities from UVJ color selections in Section 6. Alternatively, the usgsis criteria select almost all (∼95%) quiescent galaxies in this sample at the cost of much higher contamination rates (∼60%).
Even though the photometric redshifts of these bright quiescent galaxies agree well with the spectroscopic redshifts (see right panel of Figure 4), the substantial uncertainties in photometric redshifts can contribute significant systematic uncertainties to the rest-frame color estimations and scatter in color–color space. The typical uncertainties in these color estimations are shown in the left and middle panels of Figure 4. We emphasize that this scatter is not included in our purity and completeness fractions quoted above. Both the impostors and true quiescent galaxies located near these selection boundaries can shift into or out of these color selection criteria if perturbed within the confidence interval of their rest-frame colors. These uncertainties and the nuance in the definition of true quiescence (Criterion 1 versus Criterion 2) complicate the determination of systematic impurity or incompleteness in these rest-frame color selections.
Another caveat is that the completeness or purity fraction reported in this section only considers the EGS and UDS galaxies surveyed by RUBIES and is not corrected for the selection bias introduced by the RUBIES selection function. Without this correction, the purity fraction of the extended UVJ criteria is likely prone to underestimation. These criteria include younger quiescent galaxies but also bluer impostors (K. E. Whitaker et al. 2012; L. R. Spitler et al. 2014; C. M. S. Straatman et al. 2015). Since RUBIES preferentially targeted redder sources, which we discuss in detail in the following section, RUBIES could miss more blue impostors and underestimate the total number of sources present in the extended color region.
4.3. Correcting for Targeting Incompleteness with the RUBIES Selection Function
Spectroscopy reliably prevents the contamination of dusty star-forming galaxies in the selection of quiescent galaxies, which is unavoidable with only photometry. However, these spectroscopic surveys cannot comprehensively target every eligible source in the field. The number densities derived from this kind of spectroscopic selection must be statistically corrected for sample incompleteness. For the RUBIES massive quiescent galaxy sample, the overall sample completeness is a net product of three selection steps.
First, we consider the fraction of field sources that are eligible to be included as survey candidates (Sel). This is a function of the apparent photometric properties of the source  , which depends on their intrinsic physical properties such as stellar mass (M*), sSFR, redshift (z), and dust reddening (AV). Second, we define a variable, Sslit, to be the fraction of potential sources for which suitable spectra were obtained. This fraction includes whether a source is assigned an MSA slit, whether a spectrum was successfully obtained and reduced, and whether the spectroscopic wavelength coverage, redshift quality grade, and SNR meet the PCA requirements described in Section 3.1. This is similarly a function of the photometric properties of the source
  . Third, we consider the fraction of sources included in our SC cuts among all potential quiescent sources for which a successful spectrum is obtained (SPCA). This term is a function of the source spectrum fλ and accounts for missing potential quiescent galaxies with unusual SCs. In summary, we express these terms as:
- (a)
 ,
, - (b), and
- (c)SPCA(fλ(M*, sSFR, z, AV)).


Therefore, the total sample completeness is given by

We simplify some of the terms in the selection function as follows. Since RUBIES considers any field source with F444W < 28.5 to be eligible and we have enforced all sources in this sample to have mF444W < 24, we assume Sel = 1 for all galaxies in this sample. Furthermore, SPCA has no dependency on stellar mass or redshift, since our PCA is conducted on normalized, rest-frame spectra. As we have shown, the SC selection of quiescent galaxies has an effective limit in dust attenuation of AV < 0.7, where we assume SPCA ∼ 1 at AV < 0.7 and sSFR < 10−10 yr−1. With these simplifications, we show that Stot only depends on Sslit for the quiescent galaxies in our selection.
RUBIES selects spectroscopic targets from eligible sources in CEERS/EGS and PRIMER/UDS according to their photometric redshifts, F444W magnitudes, and F150W − F444W colors (A. de Graaff et al. 2025a). To estimate Sslit, we divide the finalized quiescent galaxies, RUBIES sources with successful spectra, and eligible parent sources into three redshift bins: [2, 3], [3, 4], and [4, 5]. In Figure 5, we show the color–magnitude distribution of finalized quiescent galaxies (using the same color coding as in previous figures), RUBIES sources with successful spectra (black dots), and the parent photometric catalog sources (gray dots) in each redshift bin. We select the approximate color–magnitude space occupied by the quiescent galaxies in this sample in each redshift bin (thick gray dashed line) and divide these color–magnitude spaces into smaller boxes that are 1 mag in width (thin gray dashed line). We mask out the faint regime (mF444W > 24), which is excluded by the quiescent galaxy selection in this sample. In each color–magnitude box (m), we count the total number of quiescent galaxies in this sample NQG,surveyed,m (hexagons), the number of RUBIES targets with a successful spectrum (Nsurveyed,m; black dots), and the number of eligible parent sources (Ntotal,m; gray dots). The fraction of eligible sources which yield successful spectra varies smoothly in the color–magnitude space (A. de Graaff et al. 2025a). This allows us to approximate this fraction as a constant per color–magnitude box:  , when
  .
.
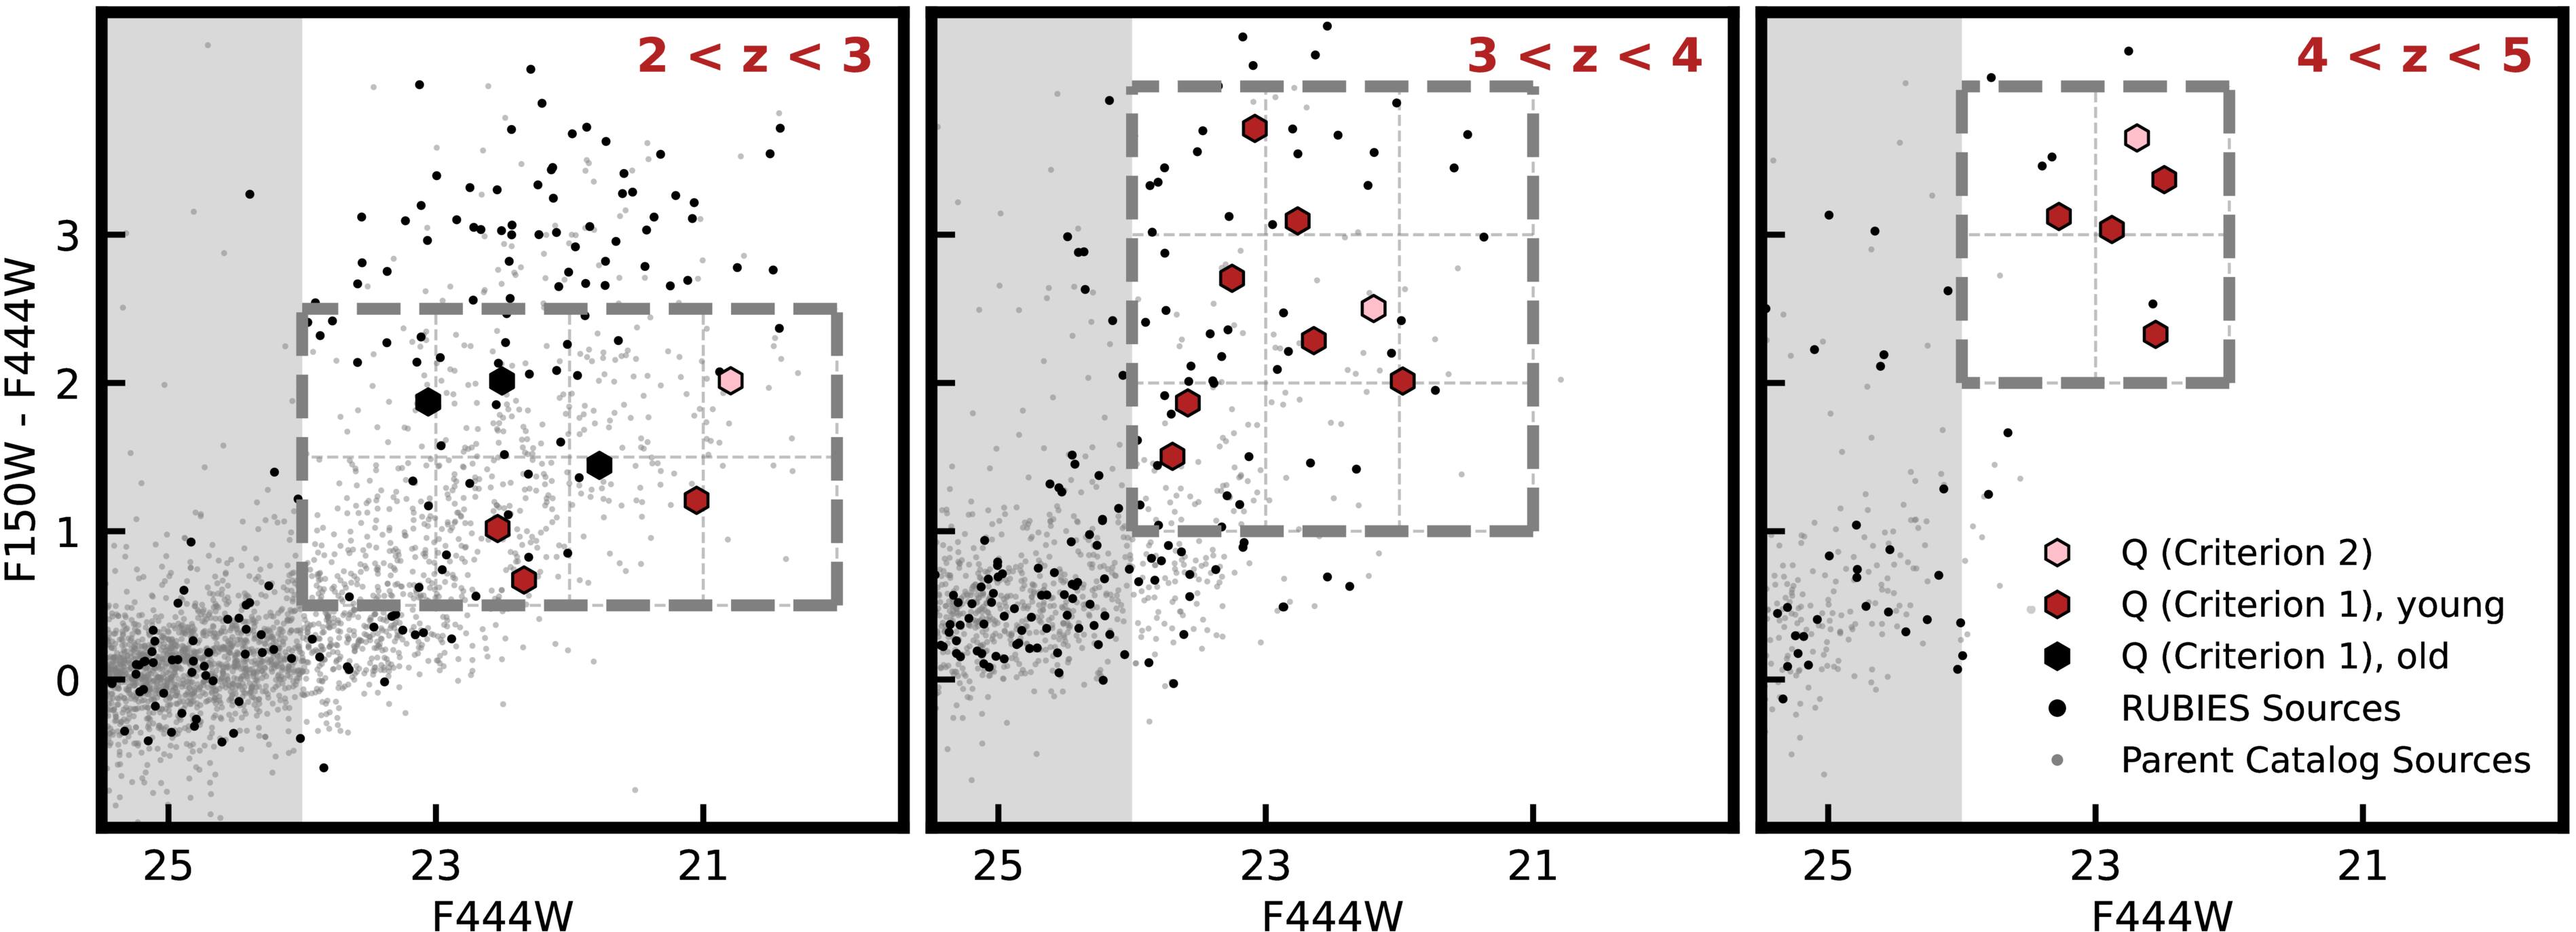
Figure 5. The parent catalog F444W magnitude versus F150W − F444W color of this quiescent sample, RUBIES surveyed sources, and all parent catalog sources in PRIMER/UDS and CEERS/EGS in three redshift bins. These panels illustrate the survey completeness of RUBIES as a function of magnitude, color, and redshift. The boxes outlined by gray dashed lines represent the area in color–magnitude space in which we perform the completeness calculation in each redshift bin. The survey completeness is close to 100% for sources under the footprint in the color–magnitude space occupied by massive quiescent galaxies at z > 4.
Download figure:
Standard image High-resolution imageA few sources selected by RUBIES to be assigned an MSA slit fail to produce a spectrum that meets the PCA prerequisite in wavelength coverage, redshift quality grade, or SNR. However, we find that this failure rate does not have a significant dependence on color, magnitude, or redshift within the relevant parameter space. Generally, the spectroscopic redshifts recovered by RUBIES in the entire survey agree well with photometric redshifts (the normalized median absolute deviation between the two is small: σ(Δz/(1 + z)) = 0.033; A. de Graaff et al. 2025a). For the bright quiescent galaxies in this sample, the match between photometric and spectroscopic redshifts is excellent, as shown in the right panel of Figure 4. We assume that any remaining unsurveyed quiescent galaxies should also have reliable photometric redshifts. Therefore, the approximation described above is likely not affected by any catastrophic errors in photometric redshifts or biased by any potential correlation between spectrum acquisition failure and source color, magnitude, or redshift.
For a population of RUBIES massive quiescent galaxies in a narrow redshift bin, which have  ,
,  , and
, and  , the number density is given by their expected number divided by the effective survey volume:
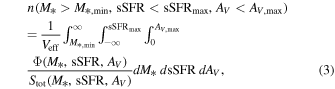
where Φ(M*, sSFR, AV) is the number of RUBIES galaxies per stellar mass per sSFR per attenuation per comoving cosmic volume. We do not intend to solve for this integral in the intrinsic parameter space, since the true distribution of Φ(M*, sSFR, AV) is challenging to constrain. We instead assume that the above integral in the intrinsic parameter space (within the effective selection limits) is equivalent to the following summation in the observed parameter space:

where nMassive,Q is the number density of massive quiescent galaxies. And Veff is given by

where Ωfield is the angular size of the effective survey area and dcom(z) is the comoving distance to redshift z.
This approximation assumes that any source with similar intrinsic properties (M*, sSFR, and AV) should display similar observed source properties (mF444W and mF150W − mF444W), in the special case of massive (M* > 1010.3 M⊙) quiescent (sSFR < 10−10 yr−1) galaxies without significant dust reddening (AV < 0.7). We essentially estimate how the selection of quiescent galaxies in RUBIES depends on their intrinsic source properties, given that we know how the selection of RUBIES sources depends on their observed source properties.
5. Quiescent Galaxy Number Densities
5.1. The Number Density of Massive Quiescent Galaxies in the RUBIES
We show the resulting comoving number densities in the left panel of Figure 6 in three flavors. The RUBIES survey footprints overlap half of the sky covered by JWST NIRCam imaging in EGS and UDS (A. de Graaff et al. 2025a). In part to maximize survey efficiency, the MSA mask design of RUBIES targets overdensities within these fields and could result in biases in our number density estimations. To probe how potential cosmic overdensities under the RUBIES footprint can impact our conclusions, we take the fiducial quiescent sample (sSFR50th < 10−10 yr−1) and calculate the number density in each redshift range using two different approaches. In the first approach, we only count parent catalog sources that fall under the survey footprint for completeness estimation. In this case, we divide the resulting expected number of quiescent galaxies by the comoving volume corresponding to only the total sky area under the footprints ( ). In the second approach, we count sources from the entire UDS/EGS footprints as Ntotal for completeness estimation. In this case, we use the comoving volume corresponding to the entire sky area of the NIRCam imaging (
 ). As shown in the left panel of Figure 6, the targeting bias due to overdensities at 4 < z < 5 results in a footprint-only number density (red) ∼0.2 dex higher than that of the full field (orange). This offset effectively reflects the cosmic variance within EGS and UDS.
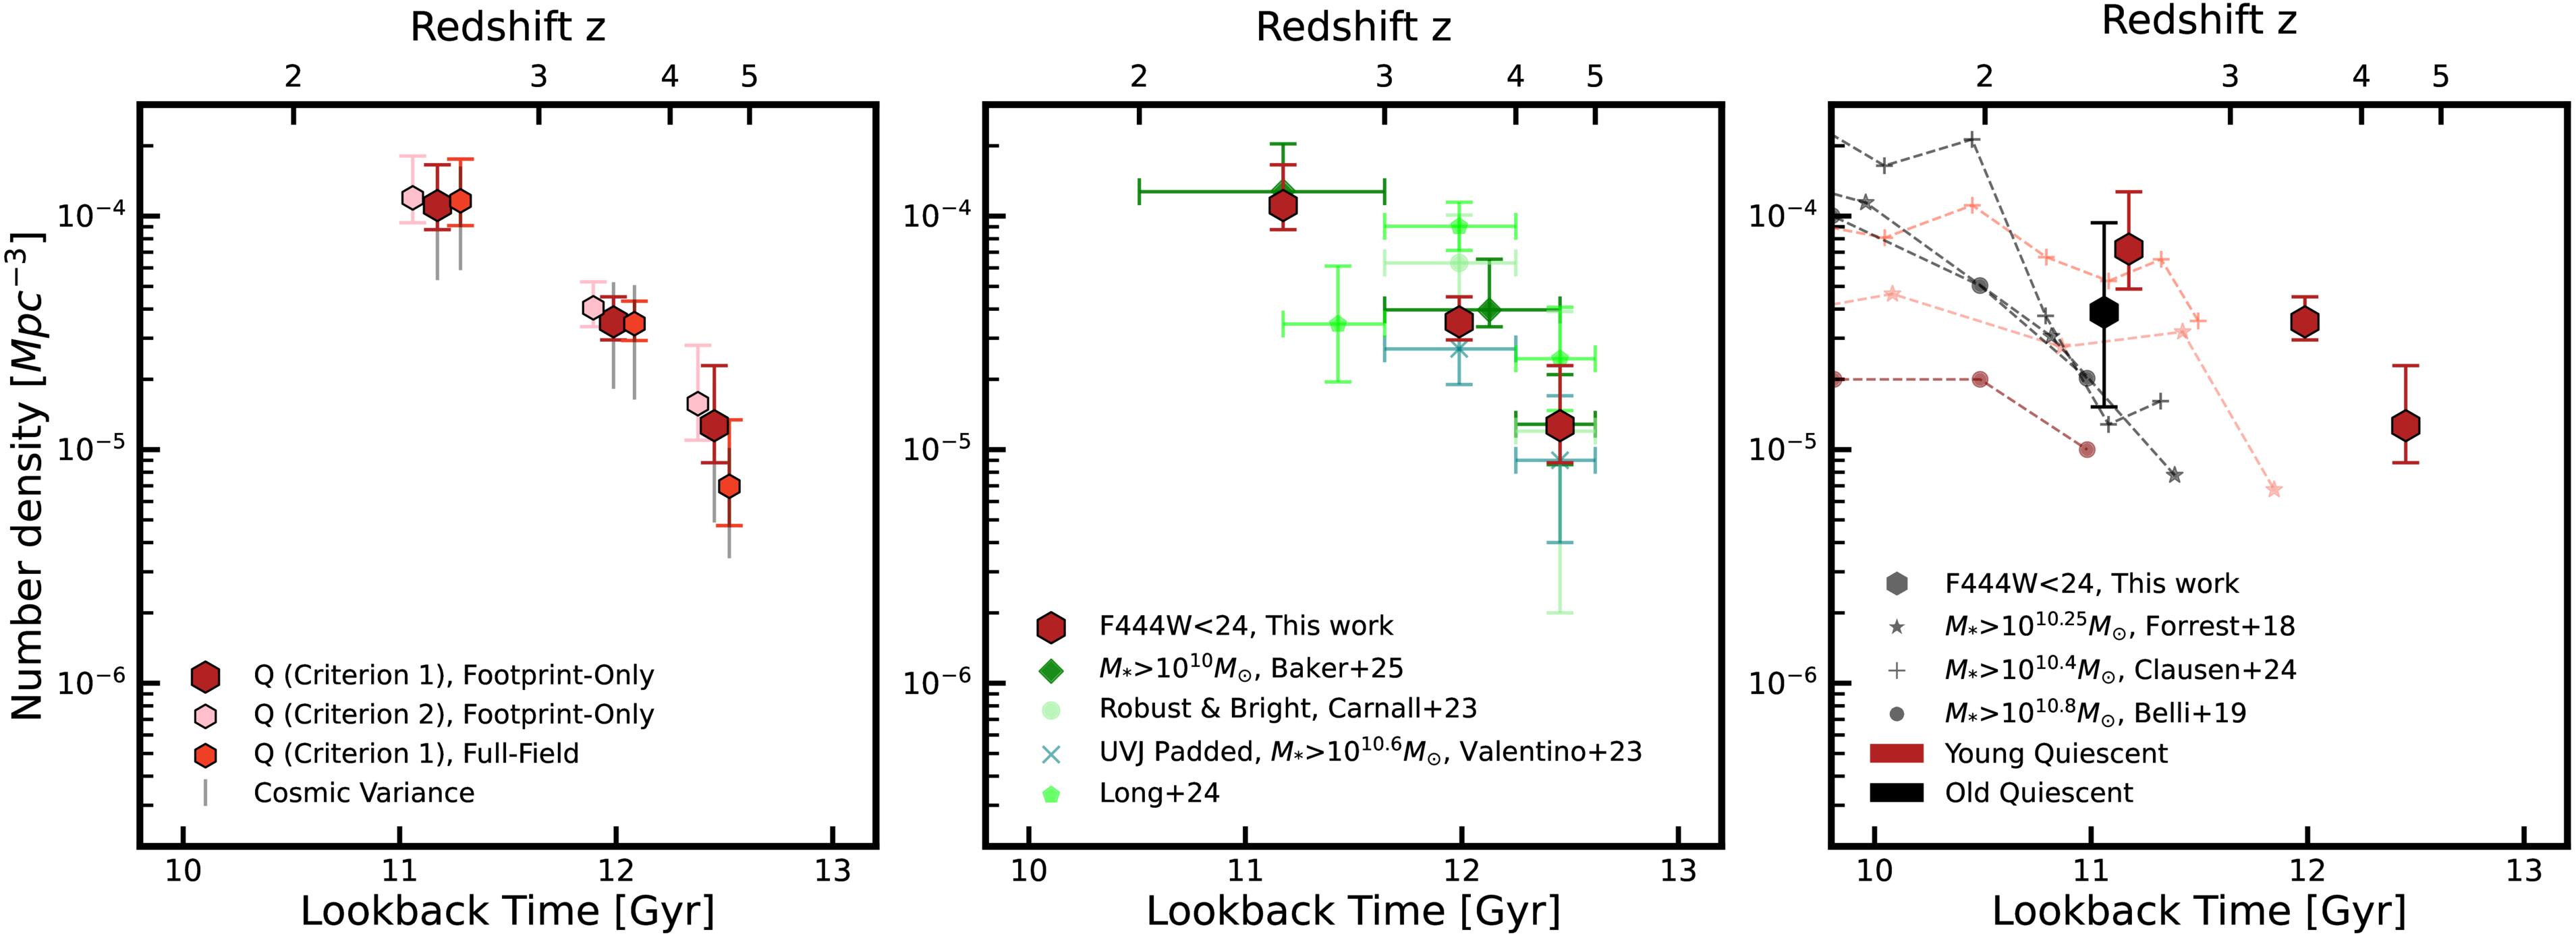
Figure 6. Left panel: different flavors of total quiescent galaxy number density binned by redshifts from this sample. We show the number density derived from the entire extended quiescent sample (pink hexagons), the entire strict quiescent sample (red hexagons), and the strict quiescent sample but using parent catalog sources from the entire field rather than just the survey footprints for the completeness calculation (orange hexagons). Neither our quiescence criteria nor any potential survey targeting bias has a significant impact on the resulting number density. Middle panel: our fiducial quiescent galaxy number density compared to literature values using JWST data. Our result is in agreement with previous JWST measurements overall. Right panel: number densities of old (t90 > 0.8 Gyr) and young (t90 < 0.8 Gyr) quiescent galaxies in this work compared to (non-JWST) literature values. We note that for these comparisons, the number densities derived from this work only adopt a magnitude limit F444W < 24 and no additional mass limit. This work finds a higher number density for young quiescent galaxies at 3 < z < 4 and for old quiescent galaxies at 2 < z < 3 than previous non-JWST works.
Download figure:
Standard image High-resolution imageTo test the impact of different quiescent criteria in Section 4.1, we calculate a third flavor with the extended quiescent sample (sSFR16th < 10−10 yr−1), adopting the “footprint-only” approach. An extended criterion for quiescent galaxy selection (Criterion 2) slightly increases the resulting number density (pink; Figure 6, left panel) at all redshifts by ∼0.1 dex. We tabulate the various flavors of quiescent galaxy number densities in Table 1. Overall, these variations are insignificant compared to uncertainties due to cosmic variance, which we will describe in the following. We choose to report the number densities calculated with the “Criterion 1” sample and the “footprint-only” approach as our fiducial result.
Table 1. RUBIES Massive Quiescent Galaxy Number Densities
| Mass or Magnitude Limit | mF444W < 24 | mF444W < 24 | M* > 1010.5 M⊙ |
|---|---|---|---|
| Quiescence Criterion | sSFR50th < 10−10 yr−1 | sSFR16th < 10−10 yr−1 | sSFR50th < 10−10 yr−1 |
| (Mpc–3) | (Mpc–3) | (Mpc–3) | |
| 2 < z < 3 |

|

|

|
| 3 < z < 4 |

|

|

|
| 4 < z < 5 |

|

|

|
Download table as: ASCIITypeset image
To estimate the measurement uncertainties on the derived number densities, we calculate the binomial proportion confidence interval for the spectroscopic completeness in each color–magnitude box (Nsurveyed,m/Ntotal,m), following the method in E. B. Wilson (1927; the Wilson score interval). We propagate the confidence interval in completeness into number densities, using Equation (4). We plot the resulting uncertainties due to counting and completeness corrections as colored error bars in the left panel of Figure 6.
Additionally, we estimate the systematic uncertainty due to cosmic variance using a method similar to that described in L. Taylor et al. (2022). Briefly, we use ∼1300–2300 mock light cones of similar area to the RUBIES survey derived from the UniverseMachine model (P. Behroozi et al. 2019) run on the MDPL2 dark-matter-only N-body simulations (K. Riebe et al. 2013). Mock galaxies are rank ordered by stellar mass, and comparison samples are abundance matched (to observed number densities in each redshift range) to estimate the 1σ scatter in the field-to-field variation. Due to the small survey volume of RUBIES, the estimated cosmic variance is large (∼60%) and dominates the uncertainty budget for this sample.
5.2. Comparing to Other Observational Results
In the middle panel of Figure 6, we compare our fiducial quiescent galaxy number densities to other JWST observations. Overall, our measurements are in good agreement with other JWST results. Notably, W. M. Baker et al. (2025a), which is the only other spectroscopic sample shown, is the most consistent with our results at 2 < z < 4. That work combined multiple NIRSpec observation programs (D. J. Eisenstein et al. 2025, 2023) targeting the GOODS fields (M. Giavalisco et al. 2004) and utilizes a similar approach: preselecting quiescent candidates with rest-frame UVJ colors (with an extended color cut) and finalizing with results from spectrophotometric modeling. They report five quiescent galaxies at 4 < z < 4.5 but none above z > 4.5. Taken together with our results, this suggests that the number density of quiescent galaxies likely drops steeply at 4 < z < 5.
The other literature samples shown in the middle panel of Figure 6 are derived from photometric samples. A. C. Carnall et al. (2023a) selected quiescent galaxies based on sSFRs inferred from photometry-only SED fits, using the NIRCam imaging data of CEERS/EGS (which partially overlaps with the RUBIES footprint); we show the “robust, bright” subsample.29 That study adopted a redshift-dependent sSFR cut that roughly approximates a rest-frame UVJ selection. A. S. Long et al. (2024) selected quiescent galaxies from the same dataset (CEERS/EGS) based on observed-frame colors, using color cuts informed by model templates. F. Valentino et al. (2023) derived number densities by combining the quiescent galaxies selected with rest-frame colors from all available fields at the time. We choose the version of their results computed with the massive subsample, which was selected with the padded UVJ selection criteria.
Most of the number densities derived from photometric samples appear to be (0.3–0.5 dex) higher than ours at 3 < z < 5. These studies overlap with RUBIES partially in CEERS/EGS or PRIMER/UDS. While the nonoverlapping sources between RUBIES and these studies can contribute to this discrepancy, it is also likely that the discrepancy between the A. C. Carnall et al. (2023a) sample and RUBIES is driven by the contamination of dusty star-forming objects (∼10%–35% in rest-frame UVJ selection, as reported in J. Leja et al. 2019b; J. Antwi-Danso et al. 2023; T. Nanayakkara et al. 2025; and Section 4.2). We note that A. S. Long et al. (2024) use empirical colors to select quiescent galaxies for which the systematic contamination or incompleteness is challenging to estimate. F. Valentino et al. (2023) report a slightly lower number density at 3 < z < 4, which can be explained by its mass limit being 0.1 dex higher than the effective stellar mass limit in our sample at this redshift. In addition, the known overdensities at 3 < z < 4 in CEERS/EGS (“Cosmic Vine;” S. Jin et al. 2024) can drive the number densities in this work to be higher, since the F. Valentino et al. (2023) sample is further constrained by various other lines of sight. However, the contribution to the final statistic from intrinsic overdensities in CEERS is likely small, since similar results are obtained in W. M. Baker et al. (2025a).
In the right panel of Figure 6, we separate the Criterion 1 galaxies in this sample by t90 into young and old quiescent galaxies and calculate their number densities respectively using parent catalog sources in the RUBIES footprint. This is a key benefit of including spectroscopic information in our analysis. We further compare these to (pre-JWST) literature measurements at lower redshifts that rely on spectroscopy (B. Forrest et al. 2018; S. Belli et al. 2019) or photometry (M. Clausen et al. 2024) to estimate galaxy ages. We find that the number density of older quiescent galaxies from pre-JWST samples is systematically lower than the median estimation from RUBIES at 2 < z < 3, although these results are marginally within our measurement uncertainties. However, for young quiescent galaxies, there is a large discrepancy (almost 1 dex) in number density at z > 3 between RUBIES and the only non-JWST result at these redshifts (B. Forrest et al. 2018), potentially due to differences in effective mass limits. We find a relatively consistent number density (within 0.3 dex) with non-JWST literature results with similar minimum mass at 2 < z < 3 (B. Forrest et al. 2018; M. Clausen et al. 2024). The young quiescent galaxy number density at 2 < z < 3 reported by S. Belli et al. (2019) is much lower (∼0.8 dex), but for a much more massive sample (M* > 1010.8 M⊙ versus M* > 1010.3 M⊙ for RUBIES).
At z ∼ 3, these ground-based samples likely miss both the old and young quiescent galaxies compared to any JWST sample such as RUBIES, due to several factors. The selection of pre-JWST-era samples at these epochs, such as the one in B. Forrest et al. (2018; following M. Kriek et al. 2011), primarily relied on magnitude-limited K-band surveys. At low mass or high redshifts, quiescent galaxies will fall below K-band selection limits. This is especially relevant for the oldest galaxies, which have the highest M/L in the K band. This incompleteness at z > 3 is further exacerbated by the lack of rest-frame NIR coverage, which requires extrapolation to compute rest-frame V − J colors for common UVJ color selection (J. Antwi-Danso et al. 2023). Meanwhile, JWST samples reach deeper magnitude limits, cover longer wavelengths, and have yielded relatively consistent number densities of quiescent galaxies at z > 3.
Constraining the number density of the first old quiescent galaxies at cosmic noon provides an opportunity to validate the number density of young quiescent galaxies at earlier epochs. After approximately ∼0.5–1 Gyr, young quiescent galaxies at a given epoch lose the A-type stars that dominate their SEDs and thus become part of the old quiescent population in the next epoch (K. E. Whitaker et al. 2012). Therefore, the old quiescent population should be a cumulative ensemble of all quiescent galaxies quenched ∼0.5–1 Gyr ago, if rejuvenation or major mergers are infrequent among these galaxies. Since the number density of young quiescent galaxies appears to drop steeply at 4 < z < 5 (as previously discussed) and the Universe is only ∼1 Gyr old at z ∼ 5, we expect the majority of the old quiescent population uncovered at 2 < z < 3 to be descendants of the young population at z ∼ 4. Our measurements are consistent with this picture: the number density of old quiescent galaxies at 2 < z < 3 is indeed similar to or slightly higher than those of the young galaxies ∼1 Gyr beforehand. However, we note that the number density of old quiescent galaxies is fairly uncertain (∼0.5 dex) even with a broad redshift bin (equivalent to ∼1 Gyr). In the future, a larger spectroscopic census of the old quiescent population at 2 < z < 3 will help further test this interpretation.
5.3. There Are More Massive Quiescent Galaxies in the Early Universe Than Predicted by Simulations
In Figure 7, we compare the observed number density of quiescent galaxies derived from this sample to various simulation predictions discussed in C. d. P. Lagos et al. (2025). Three are semianalytical models: Shark (C. d. P. Lagos et al. 2018, 2024), GAEA (G. De Lucia et al. 2014, 2024; M. Hirschmann et al. 2016), and Galform (C. G. Lacey et al. 2016). The other three are cosmological hydrodynamical simulations: Eagle (R. A. Crain et al. 2015; J. Schaye et al. 2015; S. McAlpine et al. 2016), IllustrisTNG (A. Pillepich et al. 2018; V. Springel et al. 2018), and Simba (R. Davé et al. 2019). All three semianalytical models correspond to comoving volumes of ∼700 cMpc3, and the three cosmological hydrodynamical simulations have comoving box sizes of ∼100–150 cMpc3. All simulation predictions shown here assume a quiescence criterion of sSFR < 10−10 yr−1 and a stellar mass limit of  , regardless of dust attenuation. The simulation number densities shown in the left panel select galaxies by their exact values in stellar mass and SFR, while those in the right panel additionally consider the random errors in these properties, as described in C. d. P. Lagos et al. (2025) and G. De Lucia et al. (2024). For the curves shown in the right panel, number densities are recalculated after convolving the galaxy mass function or SFR distribution in these simulations with a Gaussian to mimic the scattering of the galaxy population in mass or SFR due to errors. We assume errors in stellar mass and SFR to be independent and these Gaussians are centered at zero with widths of 0.3 dex (except for GAEA, where the widths are 0.35 dex). These choices of Gaussian widths for error convolution are motivated by the typical uncertainties in stellar mass and SFR inferred from multiwavelength observations (A. S. G. Robotham et al. 2020; S. Bellstedt & A. S. G. Robotham 2025). Notably, incorporating scatter to emulate the effects of measurement uncertainties systematically increases the number densities in Eagle and Shark. This is likely because >1010.5 M⊙ falls in the exponential decline of the quiescent galaxy stellar mass functions in these simulations (C. d. P. Lagos et al. 2025), introducing a net upward Eddington bias and inflating number densities. For the observed quiescent galaxy number density shown in these panels, we take the fiducial sample (Criterion 1) and remove galaxies with
  in the 2 < z < 3 bin, in order to be consistent with the sSFR or mass limit in these simulations. W. M. Baker et al. (2025b) have shown that the observed quiescent galaxy stellar mass function is flat at a
  cutoff at 2 < z < 4. Therefore, the number density derived from RUBIES is potentially not sensitive to the Eddington bias discussed above at z < 4.
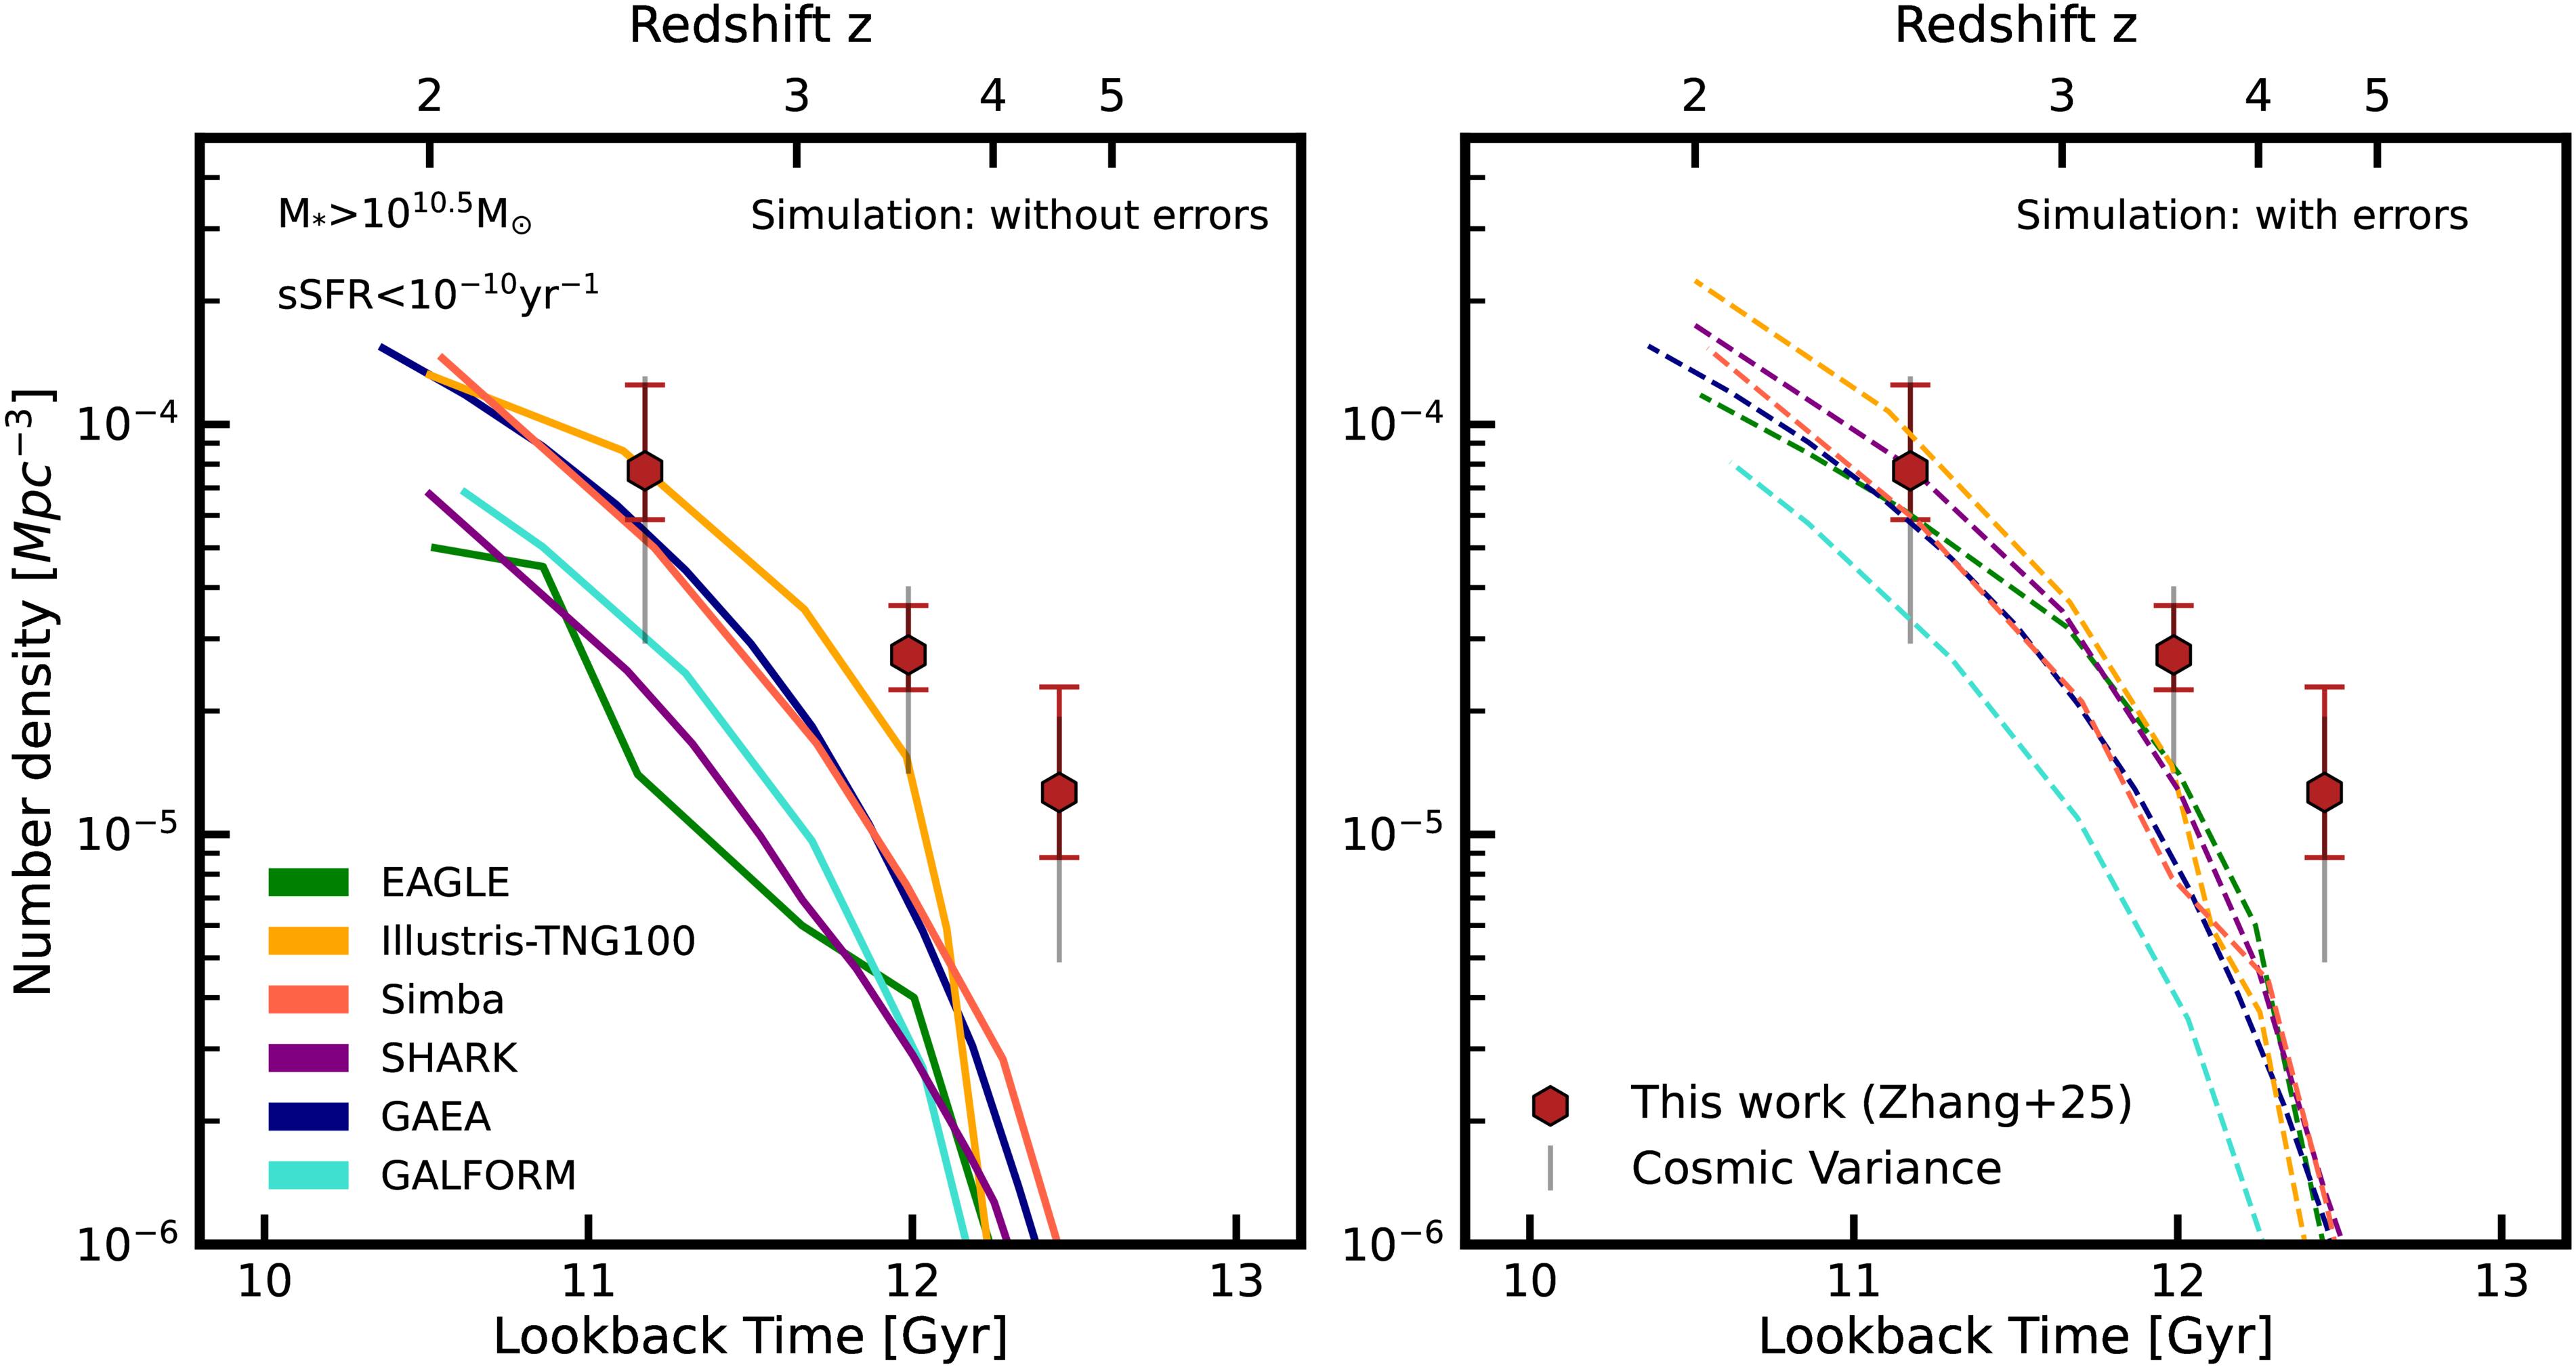
Figure 7. The quiescent galaxy number density reported in this work compared to simulation predictions in the literature. Both the observed and simulation values are computed assuming a quiescence criterion of sSFR < 10−10 yr−1 and a mass limit of  . Note that we have removed lower-mass galaxies (
 ) in the 2 < z < 3 bin to achieve a uniform mass limit in this comparison. The simulation values shown in the right panel are computed with random errors in M* and SFR while those in the left are computed without considering those errors. At z > 3, all simulations shown here underpredict the population abundance of quiescent galaxies.
Download figure:
Standard image High-resolution imageAt face value, only Simba, IllustrisTNG, and GAEA agree well with the observed number density of quiescent galaxies at 2 < z < 3. After emulating measurement uncertainties, all six simulations are largely consistent with observational data at cosmic noon. However, at earlier times, all simulations underpredict the observed number densities, by ∼0.4 dex at 3 < z < 4 and ∼1 dex at 4 < z < 5. This discrepancy persists regardless of our empirical definition of quiescence; for example, using the evolving quiescence criterion of sSFR < 0.2/tUniverse(z) Gyr−1 produces similar results. Given the median theoretical number density, we would expect to find ∼1 quiescent galaxy at  at 4 < z < 5 in the total sky area covered by EGS and UDS (
 ). Yet we find five such galaxies in the ∼50% covered by the RUBIES survey (
 ). We note that cosmic variance plagues simulations and observations alike. These cosmological simulations have small box sizes (∼100 cMpc3), for which a number density of ∼10−6 cMpc−3 corresponds to one object in the entire simulation box. At 4 < z < 5, their number densities are sensitive to random counting errors. However, we emphasize that this comparison is still meaningful since the number density of quiescent galaxies in the RUBIES sample is an order of magnitude higher (∼10−5 cMpc−3). Given our consistency with previous studies, we conclude that the dramatic discrepancy between the observed and predicted quiescent galaxy populations before z > 3 is unlikely to be attributed to contamination within photometric samples or targeting biases in spectroscopic studies.
Although we expect the effect to be small, our measured number densities could be slightly underestimated at the highest redshifts due to the effective magnitude completeness limits within the RUBIES survey. The magnitude limit (F444W < 24) of our fiducial parent sample corresponds to stellar mass limits of 1010.3 M⊙ (2 < z < 3), 1010.5 M⊙ (3 < z < 4), and 1010.6 M⊙ (4 < z < 5), as discussed in Appendix B. Therefore, RUBIES could have failed to target galaxies  with high intrinsic mass-to-light ratios or near z ∼ 5. We expect this effect to be insignificant given our simulations (Figure 10). We note that it is further possible, though unlikely, that this sample is missing a significant population of heavily dust-attenuated AV > 0.7 quiescent galaxies (see details in Appendix B). Although most quiescent galaxies at z < 2.5 have AV < 0.75 (e.g., K. A. Suess et al. 2019; J. C. Siegel et al. 2025), rare counterexamples with significant dust reddening in the core (AV > 0.75, D. J. Setton et al. 2024; J. C. Siegel et al. 2025) or the outskirts (Z. Ji et al. 2024) exist. However, these sources of sample incompleteness would only exaggerate the tension between simulations and observations.
Among these simulations and models, the wide range of predicted quiescent number densities at a given redshift is mainly due to the different implementations of AGN feedback (see C. d. P. Lagos et al. 2025, for detailed discussion). Further modifications to the AGN feedback implementation could resolve the current tension in quiescent galaxy number densities. Although hard to pinpoint observationally, many lines of evidence point toward the simultaneity of quenching and AGN activity. For example, the AGN incidence rate of massive quiescent galaxies at similar epochs (∼50% from a multiwavelength search by W. M. Baker et al. 2025a; ∼20% from analysis of optical emission lines in M. Martínez-Marín et al. 2024; K. Ito et al. 2025a) is much higher than that of the youngest quiescent galaxies at low redshifts (J. E. Greene et al. 2020). A number of the quiescent galaxies in this sample exhibit strong nebular emission lines, which hints at the incidence of nuclear activities, although we defer that analysis to a future study. Including reionization physics has been shown to significantly boost the number of quiescent galaxies at earlier times (z ∼ 5.5; H. G. Chittenden et al. 2025), which could ultimately become important in resolving tension with future theoretical models.
In the future, the lack of massive quiescent galaxies in state-of-the-art galaxy formation simulations needs to be investigated further to separate two compounding issues. One is the potential overall lack of massive galaxies (either star forming or quenched; e.g., A. Weibel et al. 2024; M. Shuntov et al. 2025), which would point to star formation not being efficient enough or, conversely, feedback being too strong in regulating star formation in the early Universe. The second one is AGN feedback itself, and whether the processes it encompasses (e.g., mechanical, radiative, or energetic feedback) are sufficient to quench massive galaxies in the early Universe. It is clear that this field is nascent, and further observations of massive quiescent galaxies and their stellar mass distribution over larger samples would provide invaluable constraints for galaxy formation models.
A final resolution is empirical: if most apparently quiescent galaxies host heavily dust-obscured star formation, then the apparent tension could disappear. Testing this would require additional observations of apparently quiescent galaxies at 3 < z < 5 in the mid-IR (MIR) or far-IR (FIR). All of the spectroscopic identifications of quiescent galaxies thus far rely on interpreting their rest-frame optical–NIR emission. These inferences cannot yet rule out extreme birth-cloud dust attenuation (AV ∼ 5) that could hide instantaneous star formation. This scenario has already been discovered in some z < 1 optically selected poststarburst galaxies, which have FIR SFRs ∼ 1–2 dex higher than those inferred from their optical information (D. Baron et al. 2023). As revealed by our PCA (also in O. R. Cooper et al. 2025), the prevalence of galaxies that simultaneously host evolved stellar populations while being dust attenuated suggests this is plausibly a more common scenario at z > 3. If ∼90% of the rest-frame optically selected quiescent galaxies at z > 4 turned out to host star formation embedded in optically thick dust, the 1 dex discrepancy would disappear. Stellar population synthesis modeling of a truly panchromatic sample of quiescent galaxies at z > 3 could lay this uncertainty to rest; the attenuated radiation from instantaneous star formation would inevitably reradiate at MIR and FIR, testable by deeper-than-existing observations with facilities such as the Atacama Large Millimeter/submillimeter Array.
6. Summary
In this paper, we presented a sample of 17 (Criterion 1) or 20 (Criteria 1 + 2) spectroscopically confirmed massive ( ) quiescent galaxies at 2 < z < 5 and their physical properties, using JWST NIRSpec PRISM spectra from the RUBIES sample. We developed an efficient methodology to identify quiescent galaxies, performing PCA on all public DJA PRISM spectra to establish eigenspectra and identify quiescent galaxy candidates in RUBIES. We infer the properties of the stellar populations by modeling the NIRSpec PRISM spectra and NIRCam photometry for each candidate with Prospector and converge on a final spectroscopic sample. We leverage the well-defined color–magnitude targeting strategy of the RUBIES survey to derive the number density of young, old, and total quiescent galaxies between 3 < z < 5. We have obtained the following findings.
- 1.We compare our spectroscopic sample of quiescent galaxies to photometric rest-frame color selection methods, such as UVJ and usgsis. We estimate that such selections will be significantly contaminated (∼35% and ∼60%, respectively), even without uncertainties due to photometric redshifts and/or extrapolation due to, e.g., NIRCam coverage at z ≳ 3 (J. Antwi-Danso et al. 2023).
- 2.We find that the number densities of both young and old quiescent galaxies in our spectroscopic sample are systematically higher than pre-JWST samples above z > 2, but consistent with other JWST studies. Although only found at cosmic noon, the number density of older quiescent galaxies at 2 < z < 3 is consistent with the expected aging population from the previous ∼1 Gyr.
- 3.As reported in previous studies, we find that massive quiescent galaxies at z > 3 are much more common than predictions from six state-of-the-art cosmological galaxy formation simulations. This discrepancy at z > 4 is unambiguous even when the cosmic variance is included, as the number density of massive quiescent galaxies estimated with the RUBIES sample is 10 times greater than the simulation prediction at this epoch.
Understanding the formation and quenching of the first massive quiescent galaxies, indeed even just matching number densities, will require efforts on the theoretical and observational fronts. For this rare population, beating down the uncertainties due to cosmic variance by increasing surveyed volumes is critical. The comoving volume probed by RUBIES in each one of the redshift bins is merely ∼5 · 105 cMpc3, compared to simulation volumes that are typically ∼106–108 cMpc3. Dramatically increasing the area of the sky probed by JWST imaging would be an obvious first step, although we emphasize the high contamination rates of quiescent samples even with CEERS/PRIMER NIRCam photometric coverage and spectroscopic redshifts. This would be much worse in shallower imaging and/or with sparsely sampled SEDs from, e.g., COSMOS-Web. JWST parallel imaging surveys, such as PANORAMIC (C. C. Williams et al. 2025), can provide an opportunity to efficiently cover large areas (with many filters) and provide independent fields that optimally minimize cosmic variance uncertainties (C. K. Jespersen et al. 2025). However, spectroscopic confirmation will always be necessary, ideally leveraging larger imaging surveys for targeting using well-characterized selection functions as in RUBIES. Ideally, these samples will comprise maximal multiwavelength data, including coverage in the MIR and FIR, to conclusively confirm quiescence. Finally, even at cosmic noon, the number densities and ages of the descendants of these extreme, early quiescent galaxies are poorly constrained. Thus, wide-area large spectroscopic surveys like the Prime Focus Spectrograph Survey (J. Greene et al. 2022) or MOONS (R. Maiolino et al. 2020) promise to provide interesting insights into the number densities and SFHs of old quiescent systems at cosmic noon and indirectly test their earliest histories.
Acknowledgments
We thank Alan Pearl for his contribution to estimating the cosmic variance contribution to the number density uncertainties in this work. We thank Hans-Walter Rix for the valuable discussion on the selection function and correcting the spectroscopic incompleteness of massive quiescent galaxies in RUBIES.
Some of the data products presented herein were retrieved from the Dawn JWST Archive (DJA). DJA is an initiative of the Cosmic Dawn Center (DAWN), which is funded by the Danish National Research Foundation under grant DNRF140.
The Cosmic Dawn Center is funded by the Danish National Research Foundation (DNRF) under grant #140.
Support for this work was provided by The Brinson Foundation through a Brinson Prize Fellowship grant.
R.B. gratefully acknowledges support from the Research Corporation for Scientific Advancement (RCSA) Cottrell Scholar Award ID No: 27587.
The work of C.C.W. is supported by NOIRLab, which is managed by the Association of Universities for Research in Astronomy (AURA) under a cooperative agreement with the National Science Foundation.
T.B.M. was supported by a CIERA Postdoctoral Fellowship.
This work is based in part on observations made with the NASA/ESA/CSA James Webb Space Telescope. The data were obtained from the Mikulski Archive for Space Telescopes at the Space Telescope Science Institute, which is operated by the Association of Universities for Research in Astronomy, Inc., under NASA contract NAS 5-03127 for JWST. These observations are associated with program numbers 1180, 1181, 1210, 1211, 1213, 1214, 1215, 1286, 1345, 1433, 1747, 2028, 2073, 2198, 2282, 2561, 2565, 2750, 2756, 2767, 3073, 3215, 4233, 4446, 4557, 6368, 6541, and 6585. The specific observations analyzed can be accessed via DOI: 10.17909/sjsj-8p46.
Support for program No. 4233 was provided by NASA through a grant from the Space Telescope Science Institute, which is operated by the Association of Universities for Research in Astronomy, Inc., under NASA contract NAS 5-03127.
The authors acknowledge the CEERS and PRIMER teams for developing their observing program with a zero-exclusive access period.
Facility: JWST - James Webb Space Telescope.
Software: Astropy (Astropy Collaboration et al. 2013, 2018, 2022), Scipy (P. Virtanen et al. 2020), Photutils (L. Bradley 2023), SpectRes (A. C. Carnall 2017), Scikit-learn (F. Pedregosa et al. 2011), Prospector (B. Johnson & J. Leja 2017; J. Leja et al. 2017; B. Johnson et al. 2021).
Appendix A: The Star Formation Histories and Spectral Energy Distributions of the Remaining Principal Component Analysis Selected Galaxies
In Figures 8 and 9, we present the best-fitting SFHs and model SEDs, along with the observed NIRCam photometry and NIRSpec PRISM spectra, of the remaining 18 RUBIES massive quiescent galaxies (sSFR16th < 10−10 yr−1) and nine RUBIES dusty impostors with similar SCs to the quiescent galaxies. The properties of the full RUBIES quiescent sample are tabulated in Table 2.
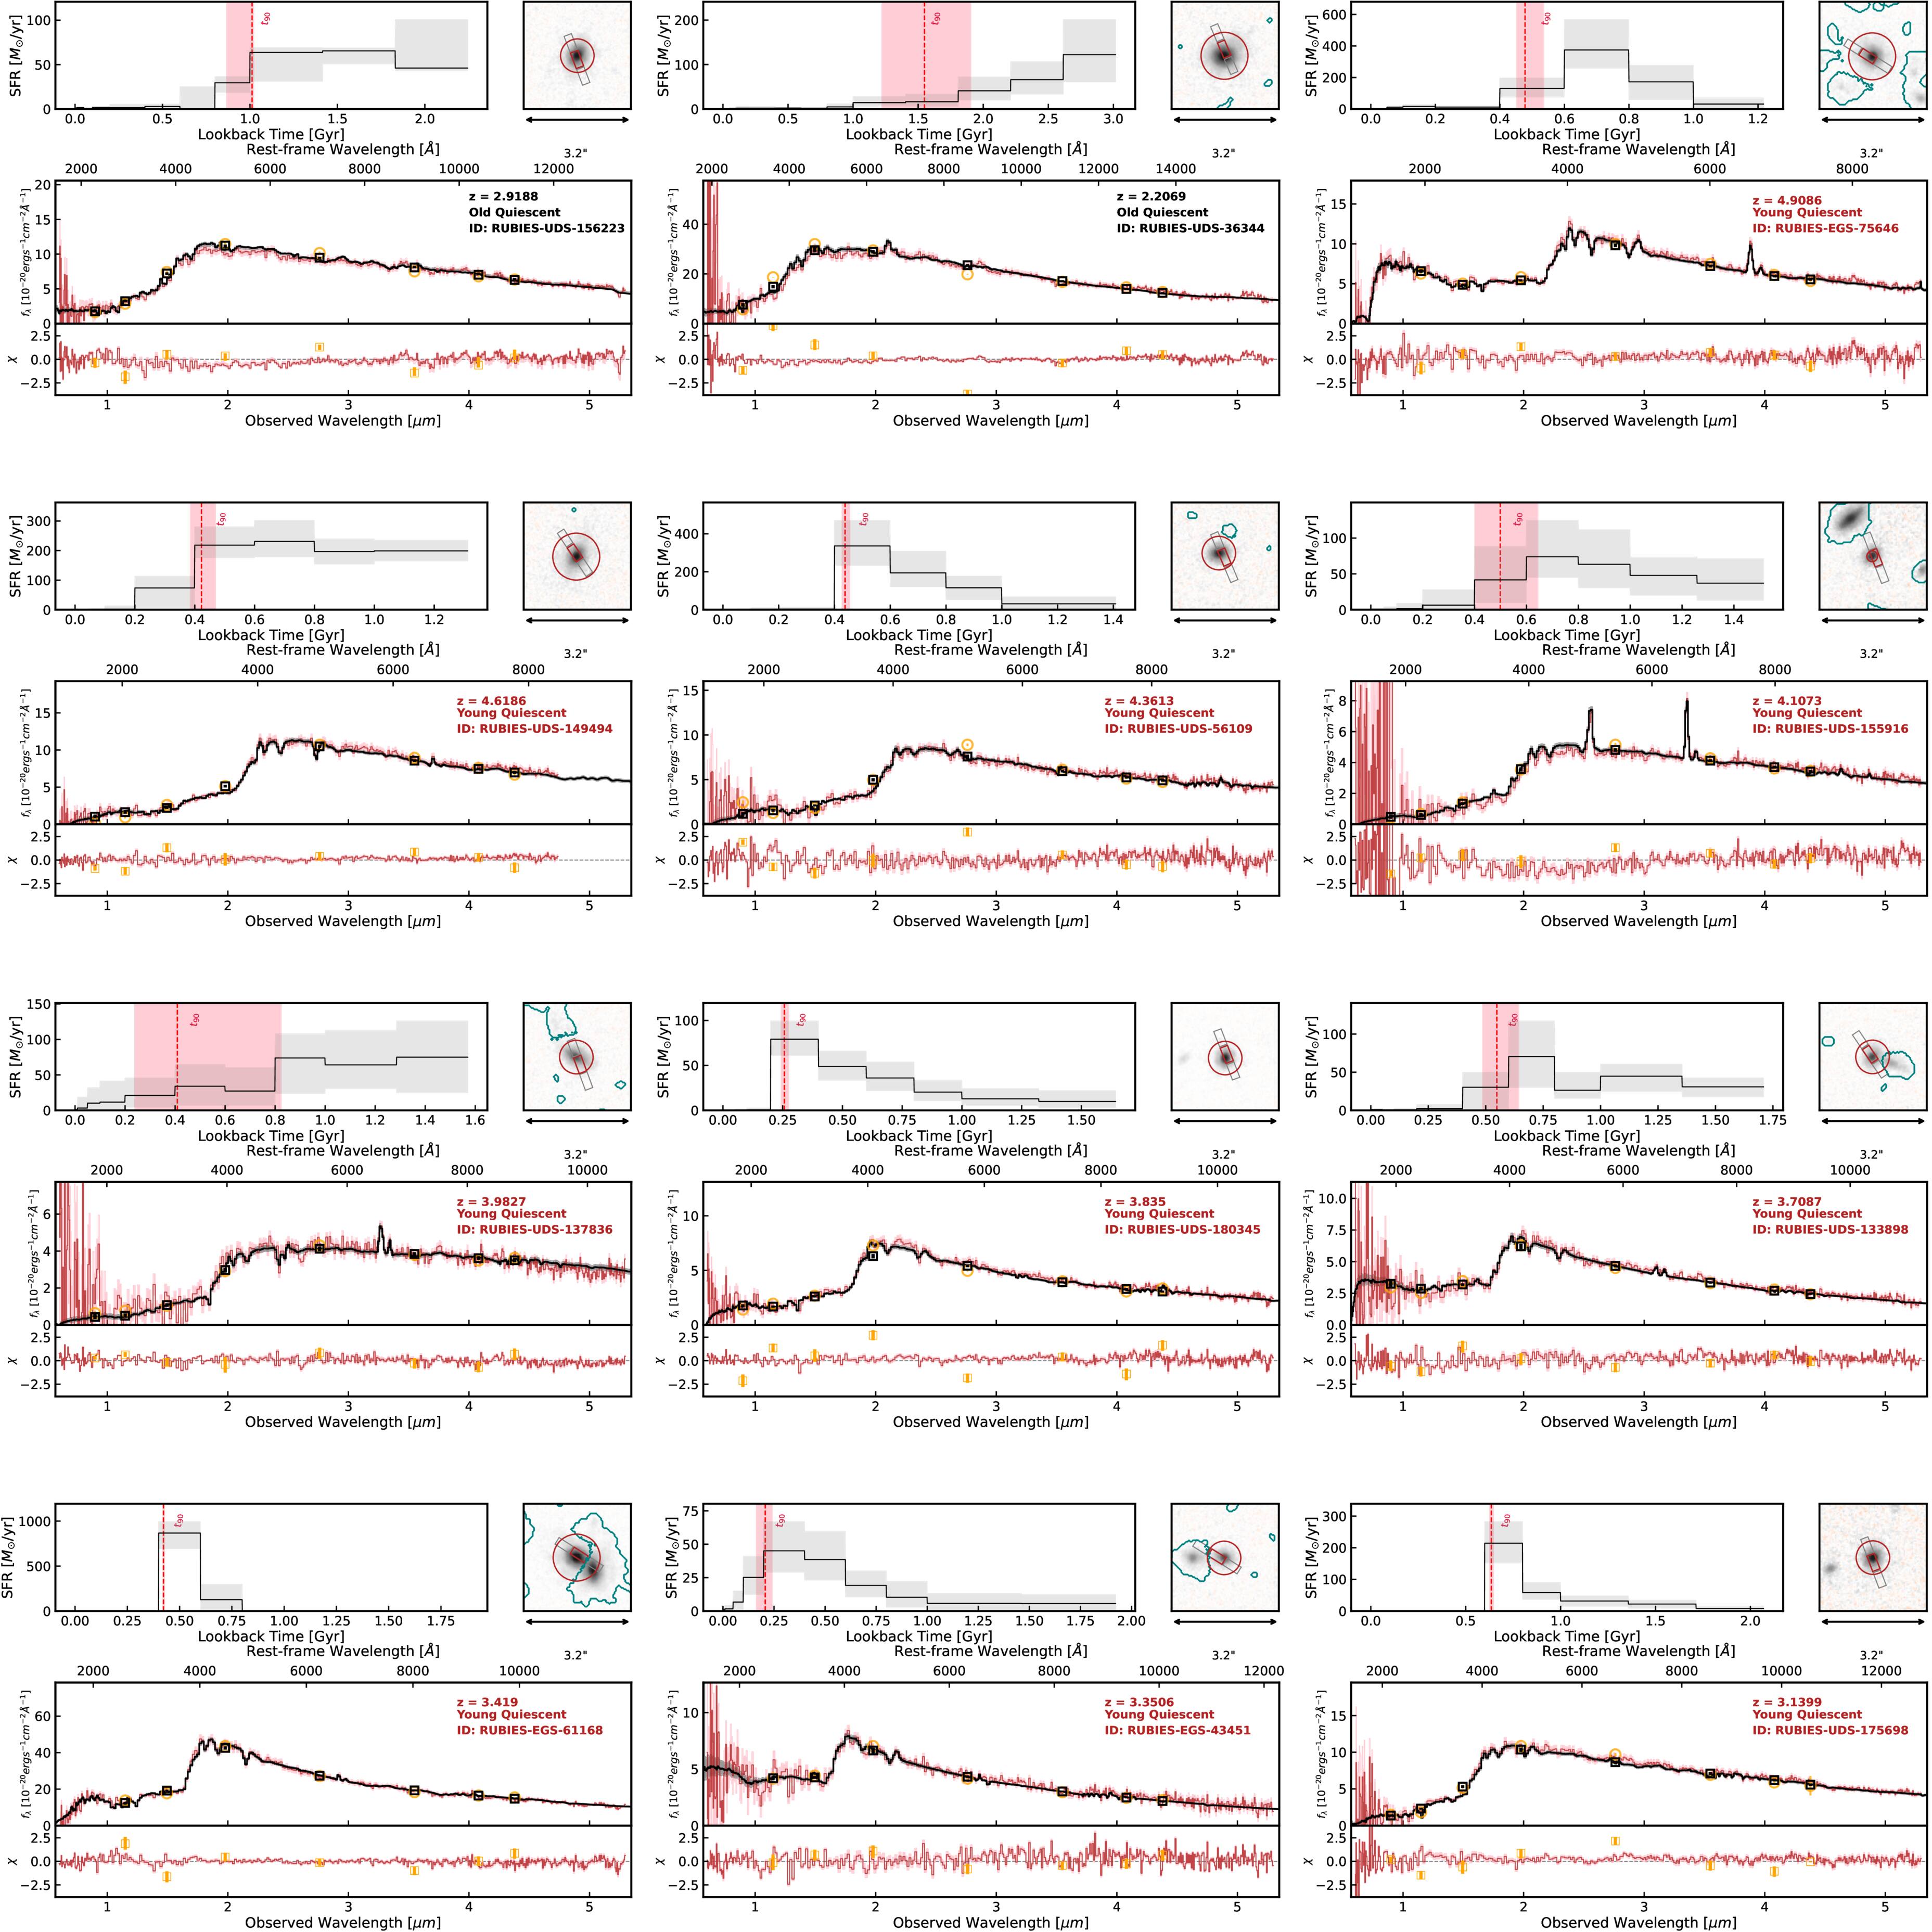
Figure 8. A gallery of the observed SEDs, best-fitting models, and SFHs of all the remaining quiescent galaxies in our sample as well as a few selected unquenched impostors. The plotting convention follows Figure 2. In addition, the teal contour in each image postage represents the mask image used during the aperture photometry extraction.
Download figure:
Standard image High-resolution image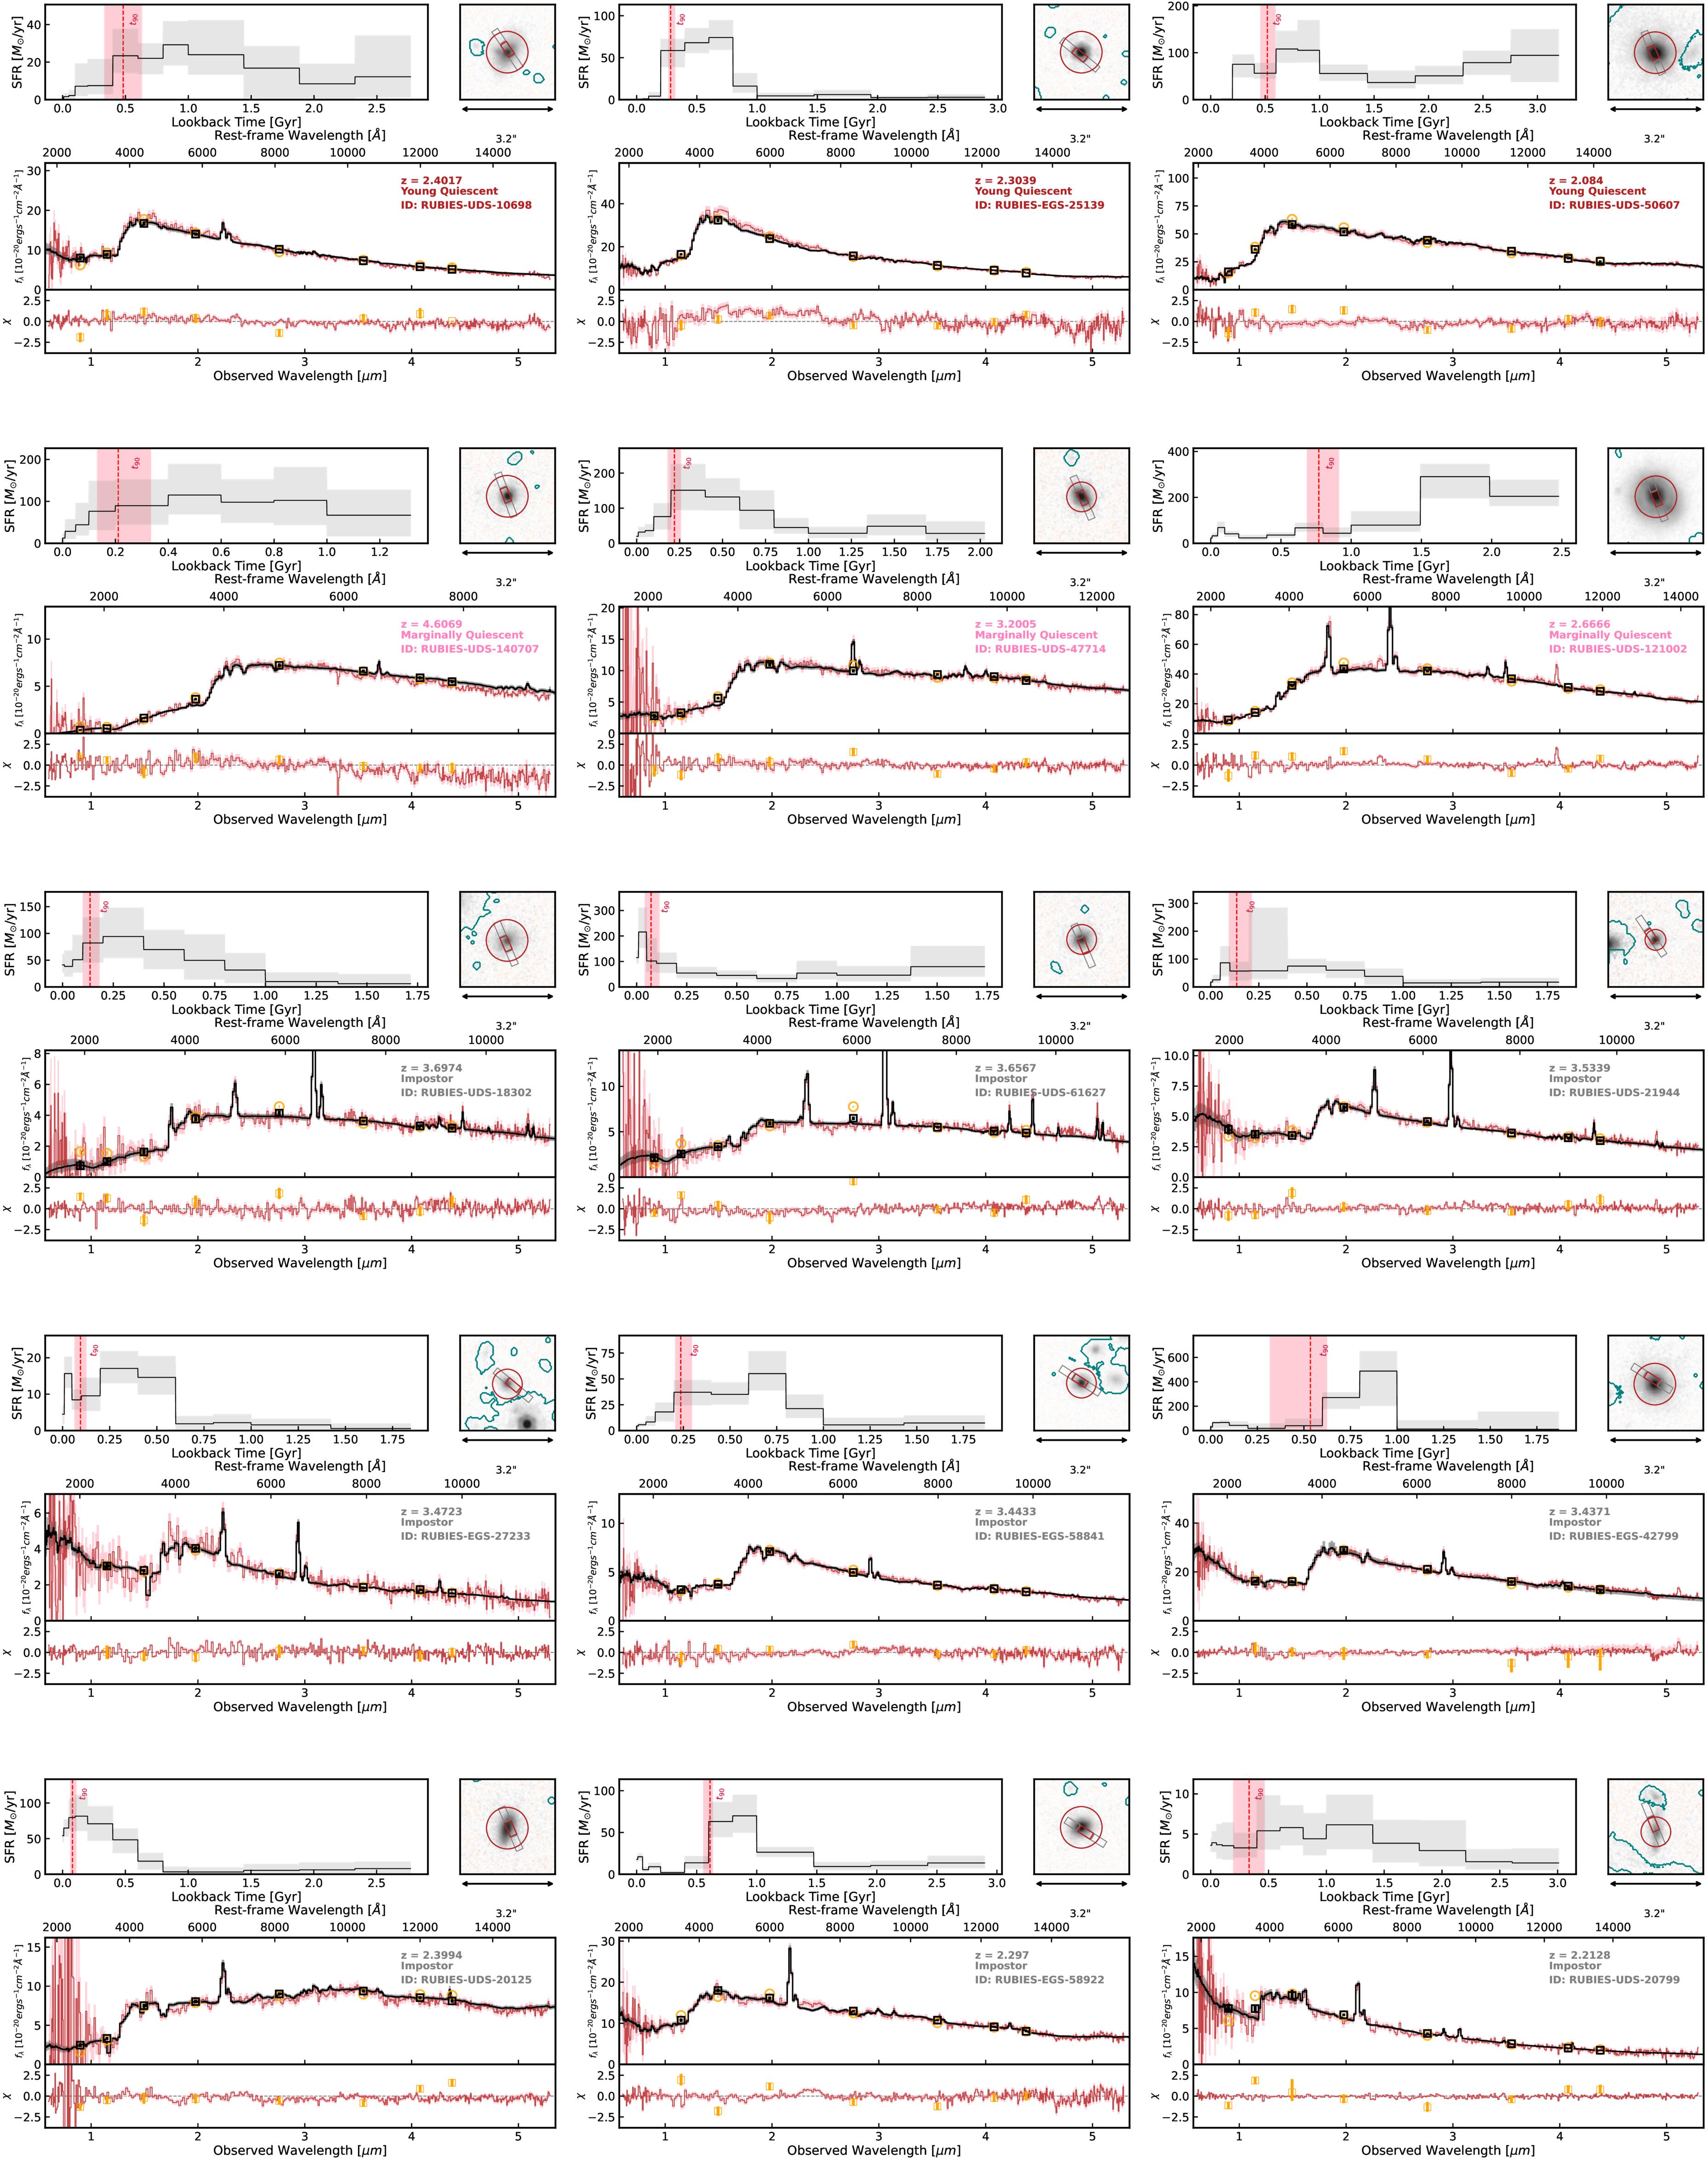
Figure 9. Continued. The plotting convention follows Figure 8.
Download figure:
Standard image High-resolution imageTable 2. RUBIES Massive Quiescent Galaxies
| Category | ID | zspec | R.A. | Decl. |

|

| t90 | SC0 | SC1 | SC2 | SC3 |
|---|---|---|---|---|---|---|---|---|---|---|---|
| (M⊙) | (yr−1) | (Gyr) | |||||||||
| Old Quiescent | RUBIES-UDS-156223 | 2.9188 | 34.334606 | −5.127057 |

|

|

| −1.44 | 0.16 | −1.00 | 0.29 |
| Old Quiescent | RUBIES-EGS-42328 | 2.6873 | 214.978556 | 52.921542 |

|

|

| −1.52 | 0.44 | −1.09 | 0.53 |
| Old Quiescent | RUBIES-UDS-36344 | 2.2069 | 34.269542 | −5.252727 |

|

|

| −1.49 | 0.32 | −1.14 | 0.30 |
| Young Quiescent | RUBIES-EGS-75646a | 4.9086 | 214.915546 | 52.949018 |

|

|

| −1.14 | −0.36 | −0.69 | −0.09 |
| Young Quiescent | RUBIES-UDS-149494b | 4.6186 | 34.399676 | −5.136348 |

|

|

| −1.46 | −0.14 | −0.93 | 0.11 |
| Young Quiescent | RUBIES-UDS-56109 | 4.3613 | 34.280515 | −5.217214 |

|

|

| −1.50 | 0.00 | −1.03 | 0.10 |
| Young Quiescent | RUBIES-UDS-155916 | 4.1073 | 34.317031 | −5.127611 |

|

|

| −1.55 | 0.19 | −1.05 | 0.29 |
| Young Quiescent | RUBIES-UDS-12594 | 3.9874 | 34.368535 | −5.299475 |

|

|

| −1.47 | 0.10 | −0.91 | 0.14 |
| Young Quiescent | RUBIES-UDS-137836 | 3.9827 | 34.360159 | −5.153092 |

|

|

| −1.45 | 0.22 | −1.09 | 0.25 |
| Young Quiescent | RUBIES-UDS-180345 | 3.835 | 34.209839 | −5.091602 |

|

|

| −1.40 | −0.37 | −0.89 | −0.13 |
| Young Quiescent | RUBIES-UDS-133898 | 3.7087 | 34.485164 | −5.157813 |

|

|

| −1.31 | −0.16 | −0.80 | −0.04 |
| Young Quiescent | RUBIES-EGS-61168 c | 3.419 | 214.866053 | 52.884257 |

|

|

| −1.35 | −0.39 | −0.86 | −0.11 |
| Young Quiescent | RUBIES-EGS-43451 | 3.3506 | 214.909553 | 52.875028 |

|

|

| −1.05 | −0.28 | −0.68 | −0.03 |
| Young Quiescent | RUBIES-UDS-175698 | 3.1399 | 34.227642 | −5.099286 |

|

|

| −1.52 | 0.06 | −1.02 | 0.23 |
| Young Quiescent | RUBIES-UDS-10698 | 2.4017 | 34.406462 | −5.302878 |

|

|

| −1.11 | −0.09 | −0.74 | 0.01 |
| Young Quiescent | RUBIES-EGS-25139 | 2.3039 | 215.113914 | 52.977721 |

|

|

| −1.41 | −0.25 | −0.95 | −0.06 |
| Young Quiescent | RUBIES-UDS-50607 | 2.084 | 34.277979 | −5.227332 |

|

|

| −1.47 | 0.13 | −0.99 | 0.20 |
| Marginally Quiescent | RUBIES-UDS-140707 | 4.6069 | 34.365084 | −5.148848 |

|

|

| −1.41 | −0.09 | −0.81 | 0.12 |
| Marginally Quiescent | RUBIES-UDS-47714 | 3.2005 | 34.25891 | −5.232334 |

|

|

| −1.48 | 0.33 | −0.97 | 0.31 |
| Marginally Quiescent | RUBIES-UDS-121002 | 2.6666 | 34.30467 | −5.175739 |

|

|

| −1.41 | 0.49 | −0.99 | 0.47 |
Notes. aAlso in A. de Graaff et al. (2025b). bAlso in A. C. Carnall et al. (2024). cAlso in K. Ito et al. (2025b) and T. Nanayakkara et al. (2025).
Only a portion of this table is shown here to demonstrate its form and content. A machine-readable version of the full table is available.
Download table as: Machine-readable (MRT)Typeset image
Appendix B: Determining the Effective Limits of this Sample in M∗ and AV
We divide the final quiescent sample (Criterion 1) into three redshift bins ([2, 3], [3, 4], and [4, 5]). For the galaxies in each redshift bin, we obtain an ensemble of their analogs by taking their best-fitting Prospector models, redshifting their model SEDs to a grid of redshifts within the corresponding bin interval, and rescaling these model SEDs to a grid of stellar masses within 1010 M⊙ < logM* < 1011 M⊙. We note that these analog SEDs include both the cosmic dimming due to their redshifts and the intrinsic brightness due to their stellar masses. Therefore, we expect these analog SEDs to approximately resemble those of the quiescent population that would have been observed at these redshifts and masses. We derive the corresponding F444W magnitudes of these dimmed and redshifted analogs, which are shown in Figure 10. Using these predicted F444W magnitudes, we determine the stellar mass at which all analogs in each redshift bin would be brighter than our magnitude limit. Our magnitude-limited selection would have been complete above 1010.3 M⊙ at 2 < z < 3, above 1010.5 M⊙ at 3 < z < 4, and above 1010.6 M⊙ at 4 < z < 5.
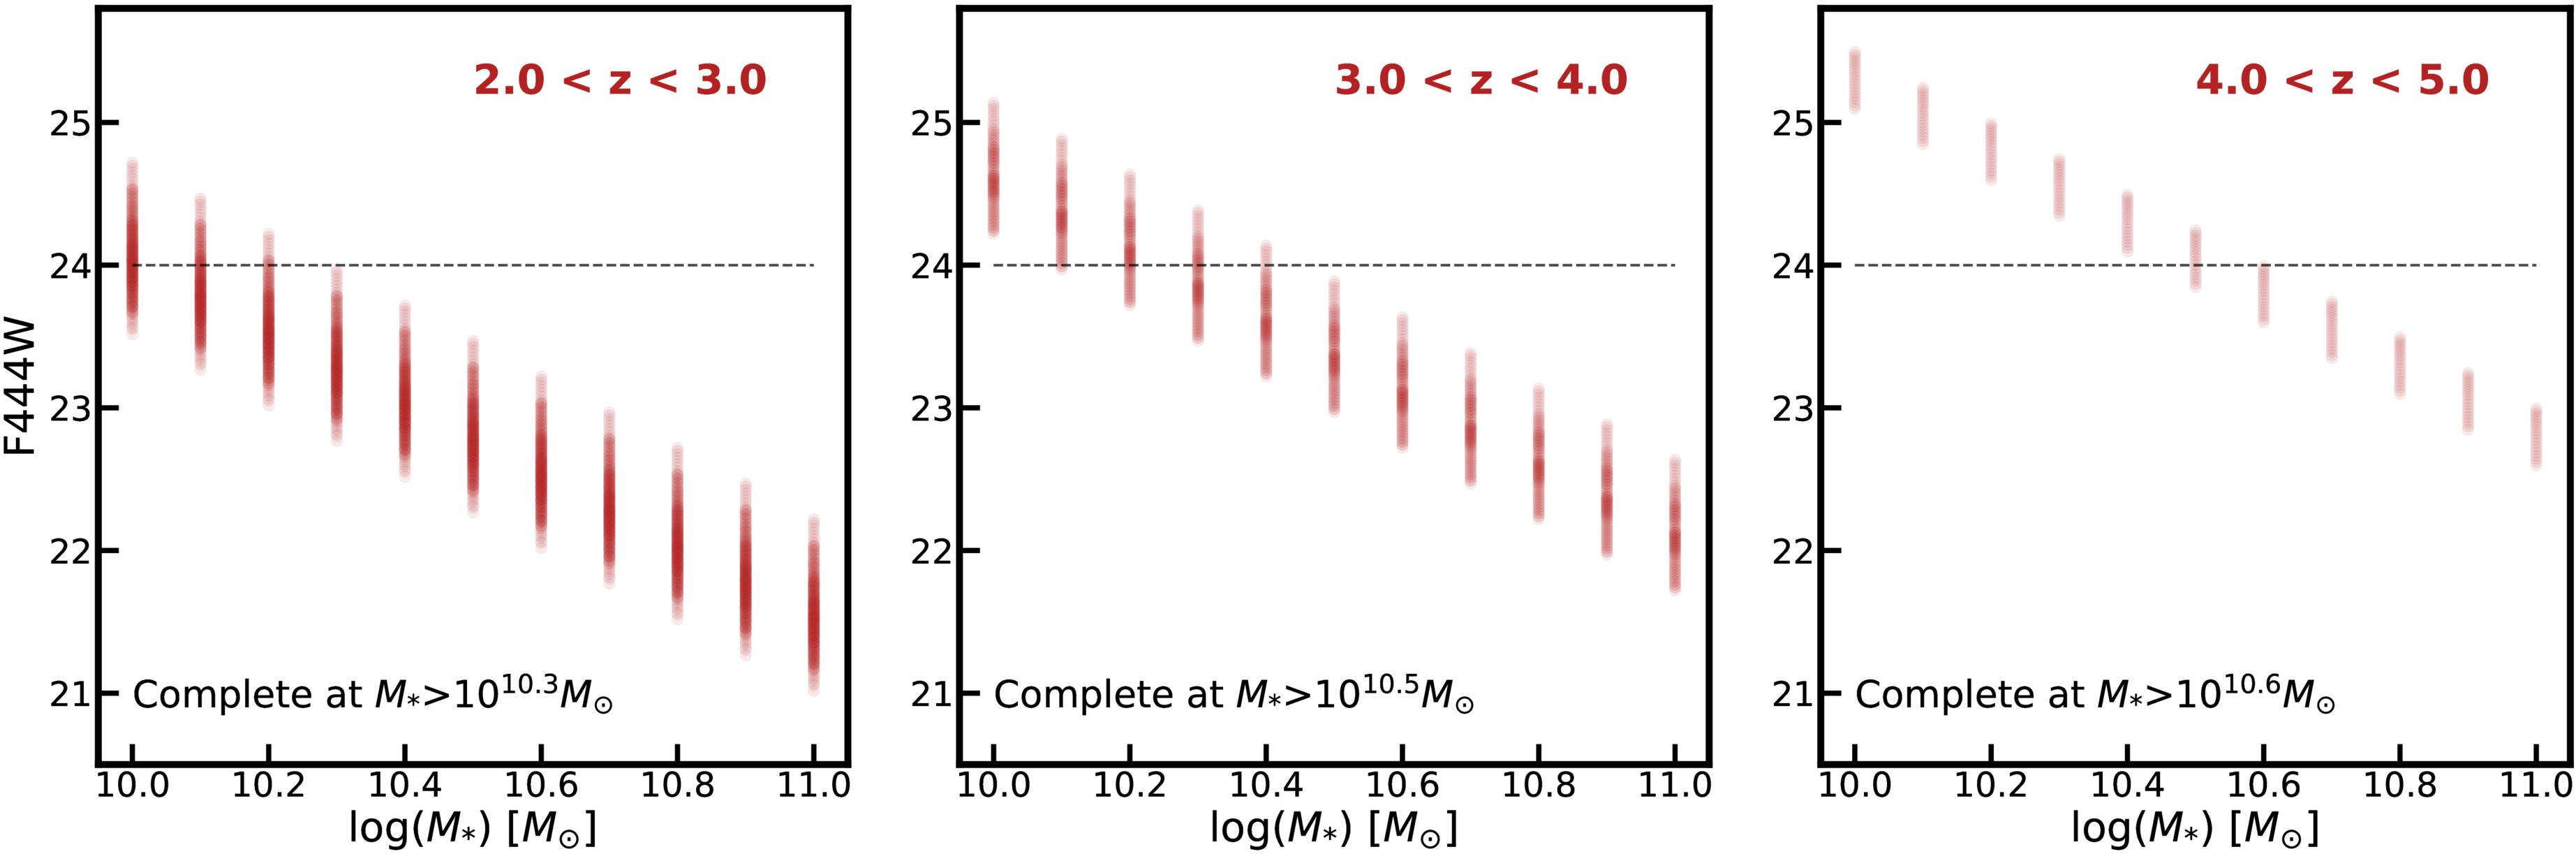
Figure 10. The F444W magnitudes of quiescent galaxies in each redshift bin predicted from the best-fitting Prospector models of quiescent galaxies (sSFR < 10−10 yr−1) in this sample, using a grid of stellar mass and redshift. The magnitude limit of this sample (mF444W < 24) would have included any quiescent galaxies with  at 2 < z < 3,
  at 3 < z < 4, and
  at 4 < z < 5, assuming the mass-to-light ratios of quiescent galaxies in this sample are representative of the entire quiescent population in each epoch.
Download figure:
Standard image High-resolution imageIn order to determine how the SCs of quiescent galaxies depend on dust attenuation, we take the best-fitting Prospector models of the fiducial quiescent sample (Criterion 1; sSFR50th < 10−10 yr−1) and generate model spectra for their analogs of different dust attenuation levels, using a grid of AV parameter inputs. For each analog model spectrum, the model setup remains the same and all other model parameters are fixed to the best-fitting values. Following the same procedure described in Section 3.1, we de-redshift and resample the model spectra to the same wavelength grid described with SpectRes. These resampled analog model spectra are also normalized by flux density at rest-frame 4500 Å. To compute the four SCs, we linearly solve for the four coefficients of eigenspectra to minimize the χ2, using a standard package in Scipy. The SCs of the fiducial quiescent sample at four selected dust attenuations are shown in the top panels Figure 11. Overall, as AV increases, the SC1 and SC3 of these galaxies increase while SC0 and SC2 decrease. In addition to the initial SC cuts, we adopt SC cuts in SC0–SC1 and SC2–SC3 that are parallel to these trends in SC as AV increases, eliminating the SC regions that are not occupied by any quiescent galaxies at any AV. The fiducial quiescent sample in this work could have been fully selected by the refined SC cuts for AV < 0.7.
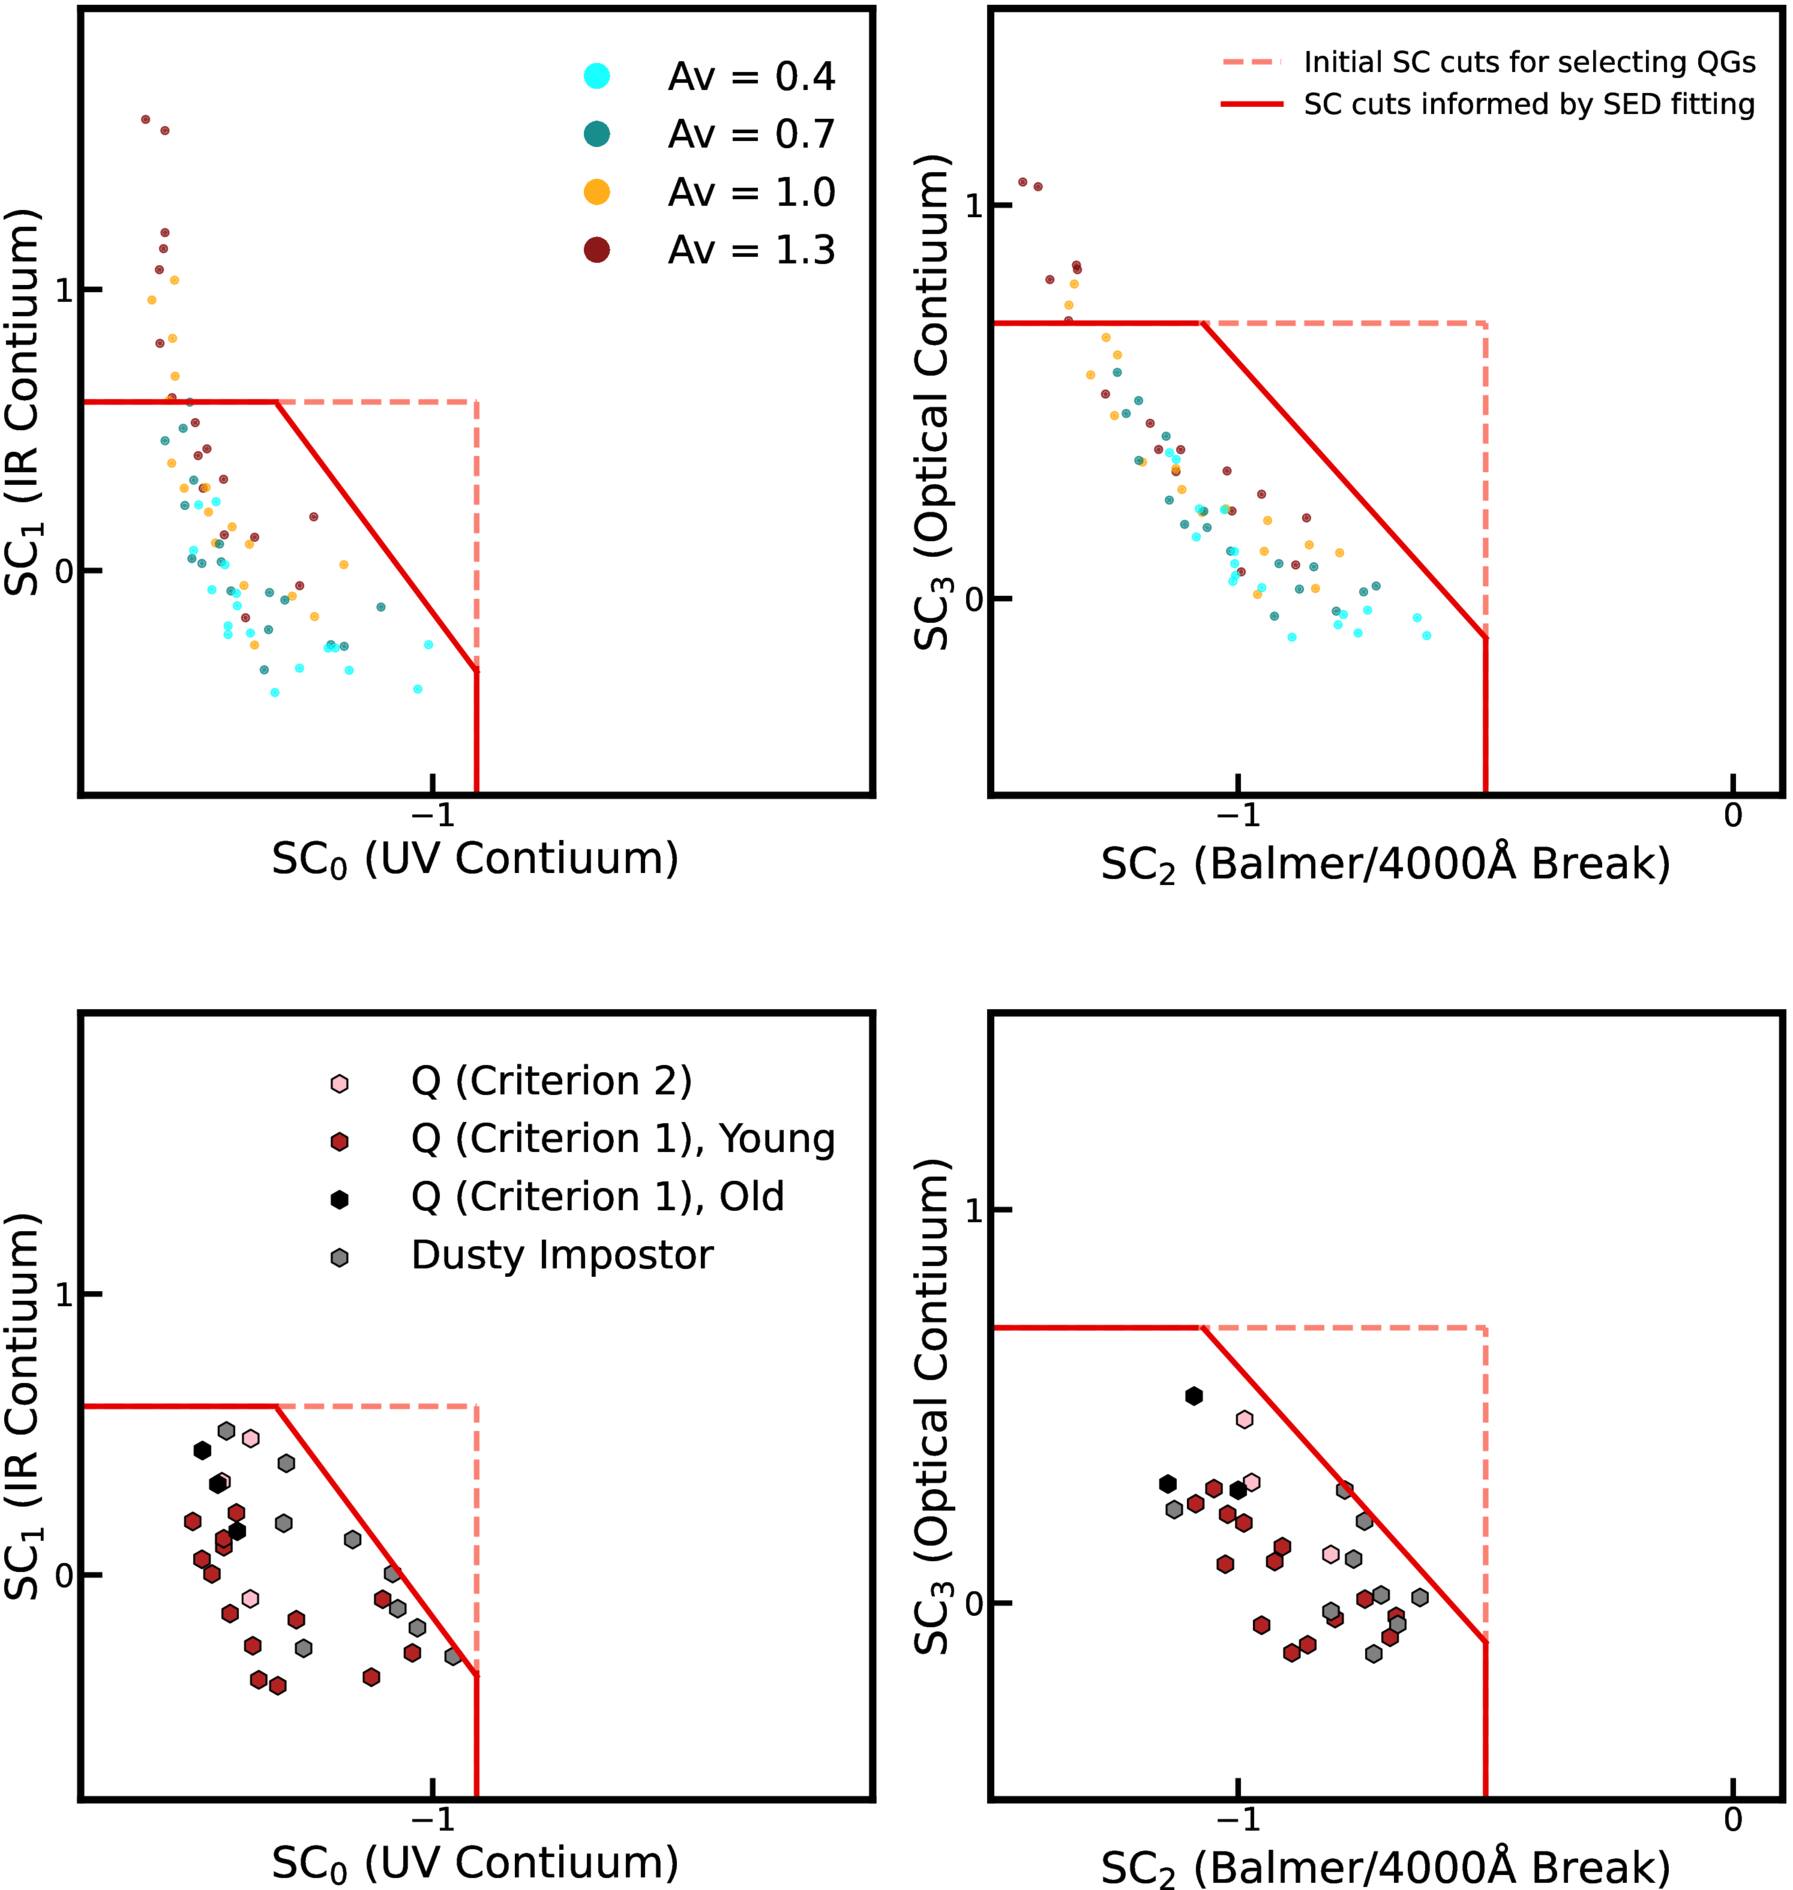
Figure 11. Top row: the SCs of quiescent galaxies predicted from the best-fitting Prospector models of quiescent galaxies (sSFR < 10−10 yr−1) in this sample, using a grid of dust attenuation (AV). The SC cuts adopted by this sample selection would have included all of the quiescent galaxies for AV < 0.7. Bottom row: the SCs of RUBIES massive quiescent galaxies and dusty impostors selected by these SC cuts.
Download figure:
Standard image High-resolution imageA final caveat regarding these SC selections is that a given source can shift ∼0.1 or less in these SC spaces, due to nuances in the spectral shape when adopting a different flux calibration. Tracking these systematic uncertainties in SCs is challenging because the flux calibration for each source is unique and complicated. To prevent an underselection of quiescent galaxies due to these uncertainties in SCs, the final SC cuts we have adopted are still considerably generous, and we have reserved space between these SC cuts and the quiescent galaxies confirmed in this study (see bottom panels of Figure 11).
Footnotes
- 23
- 24
- 25
All the JWST data used in this paper can be found in MAST: DOI: 10.17909/sjsj-8p46.
- 26
The CEERS/EGS photometry catalog (L. Wright et al. 2024) can be accessed at DOI: 10.5281/zenodo.11658282 (J. R. Weaver et al. 2024b). The PRIMER/UDS photometry catalog (S. E. Cutler et al. 2024) was created with a similar methodology but is not yet publicly released.
- 27
The spectra used to construct the eigenspectra are drawn from the following programs: GTO-1180, GTO-1181, GTO-1210, GTO-1211, GTO-1213, GTO-1214, GTO-1215, GTO-1286; ERS-1345 (CEERS) PI: Finkelstein; GTO-1433, PI: Coe, GTO-1747, PI: Roberts-Borsani; GTO-2028, PI: Wang; GTO-2073, PI: Hannawi; GTO-2198, PI: Barrufet; GTO-2282, PI: Coe; GTO-2651 (UNCOVER), PIs: Labbe and Bezanson; GTO-2565, PI: Glazebrook GTO-2750, PI: Arrabal Haro; GTO-2756, PI: Chen; GTO-2767, PI: Kelly; GTO-3073, PI: Castellano; GTO-3215, PI: Eisenstein; GTO-4233 (RUBIES), PI: de Graaff; GTO-4446, PI: Frye; GTO-4557, PI: Yan; GTO-6368 (CAPERS), PI: Dickinson; GTO-6541, PI: Egami; and GTO-6585, PI: Coulter.
- 28
This refined SC selection misses only one marginally quiescent (defined later in the text) galaxy (ID: RUBIES-EGS-37883), whose SED is difficult to model with Prospector in the current setup. This galaxy has excessive rest-frame NIR fluxes compared to the best-fitting model, which is likely caused by AGN-induced dust reemission.
- 29